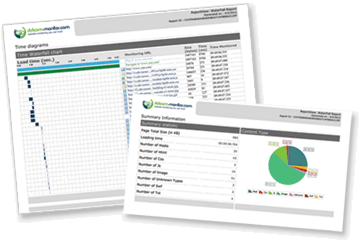
Web Page Speed – Detailed Diagnostics & Report
BrowserView Web Page Speed Monitoring continually checks overall web page performance and load times using Internet Explorer, Chrome, Firefox, or mobile browser engines from monitoring agents worldwide on a consistent monitoring frequency and sends alerts when errors are identified.
Working with BrowserView
- Setting Up A BrowserView Device
- Working with BrowserView in the API
- BrowserView Reports
- Mobile Browser Emulation
How BrowserView Works
When creating a BrowserView Device, first select which browser will conduct the monitoring of the website – a single type of browser (ex. Chrome) can be used, or individual instances of all browsers (ex. Edge, Chrome).
BrowserView connects to a website using a web browser – collecting synthetic end-user analytics of page speed and performance and can provide additional information about how to keyword test a website. If issues are detected, BrowserView sends automated alert notifications.
Alerts include diagnostics (a network traceroute, webpage code snippet, webpage snapshot, etc.). Built-in false-positive technology helps to eliminate false alerts, сustomizable escalation protocols using filters, and multi-user/group support ensures that everyone who needs to know about a problem is notified at the right time using the right notification devices. These diagnostics help pinpoint whether the root cause of the issue is an application, server, or network-related error. Getting to the root cause of the error reduces the time-to-repair and decreases the negative revenue impact of the error on customers and stakeholders.
Longer-term trend analysis helps identify common bottlenecks as well as sporadic problems.
You can quickly see:
- Page Load Times / Speeds
- Slow and Missing Elements
- Performance Bottlenecks
- Speed Breakdown by Host
- Waterfall charts (by element)
- Interactive Drill-down Reports
