If you are new to web monitoring, it might be difficult to select from the variety of different solutions and options in the market today. This article is intended to explain some basics between the different types of web monitoring offerings from Dotcom-Monitor and to help you select the right one.
Let’s say you want to monitor your website/web page or web application. All these terms can be used interchangeably, although web application can mean more than just a website – or may not even have a website and still be considered a web application (e.g. email or FTP service running on the server).
Website Monitoring
Multiple Step Process
How you can determine if your web page is working properly? The easiest way would be opening the browser and trying to visit the page. Your page may not load at all due to some network issues, errors of the server, or missing files. Are these the only issues that can happen? Unfortunately, no. Modern web pages rely on a lot of dynamic content (AJAX requests, Angular) or elements of the page that work in the browser and allow a user to interact with your app (submit forms, search, place orders, etc.). So, the fact that your page loaded in the browser doesn’t mean it’s working properly. What if the error is only happening when the user submits the form? And wait, there’s more…
Even if the page is loading properly, and there are no errors, website speed is also a big factor. If your page is taking too long to load, users may leave prematurely. Your website may even experience lower rankings from search engines. Multiple Step Process monitoring type is designed to address any of the above-mentioned issues. It allows you to record interactions with your website, turn those interactions into a script that will repeat your actions, and analyze the responses/results, ensuring everything is working properly. This is the most comprehensive monitoring solution that utilizes real browsers for testing (some errors are only discovered when using real browsers), but this type of testing also consumes a lot of resources. For additional details, read more here.
Single Web Page Monitoring
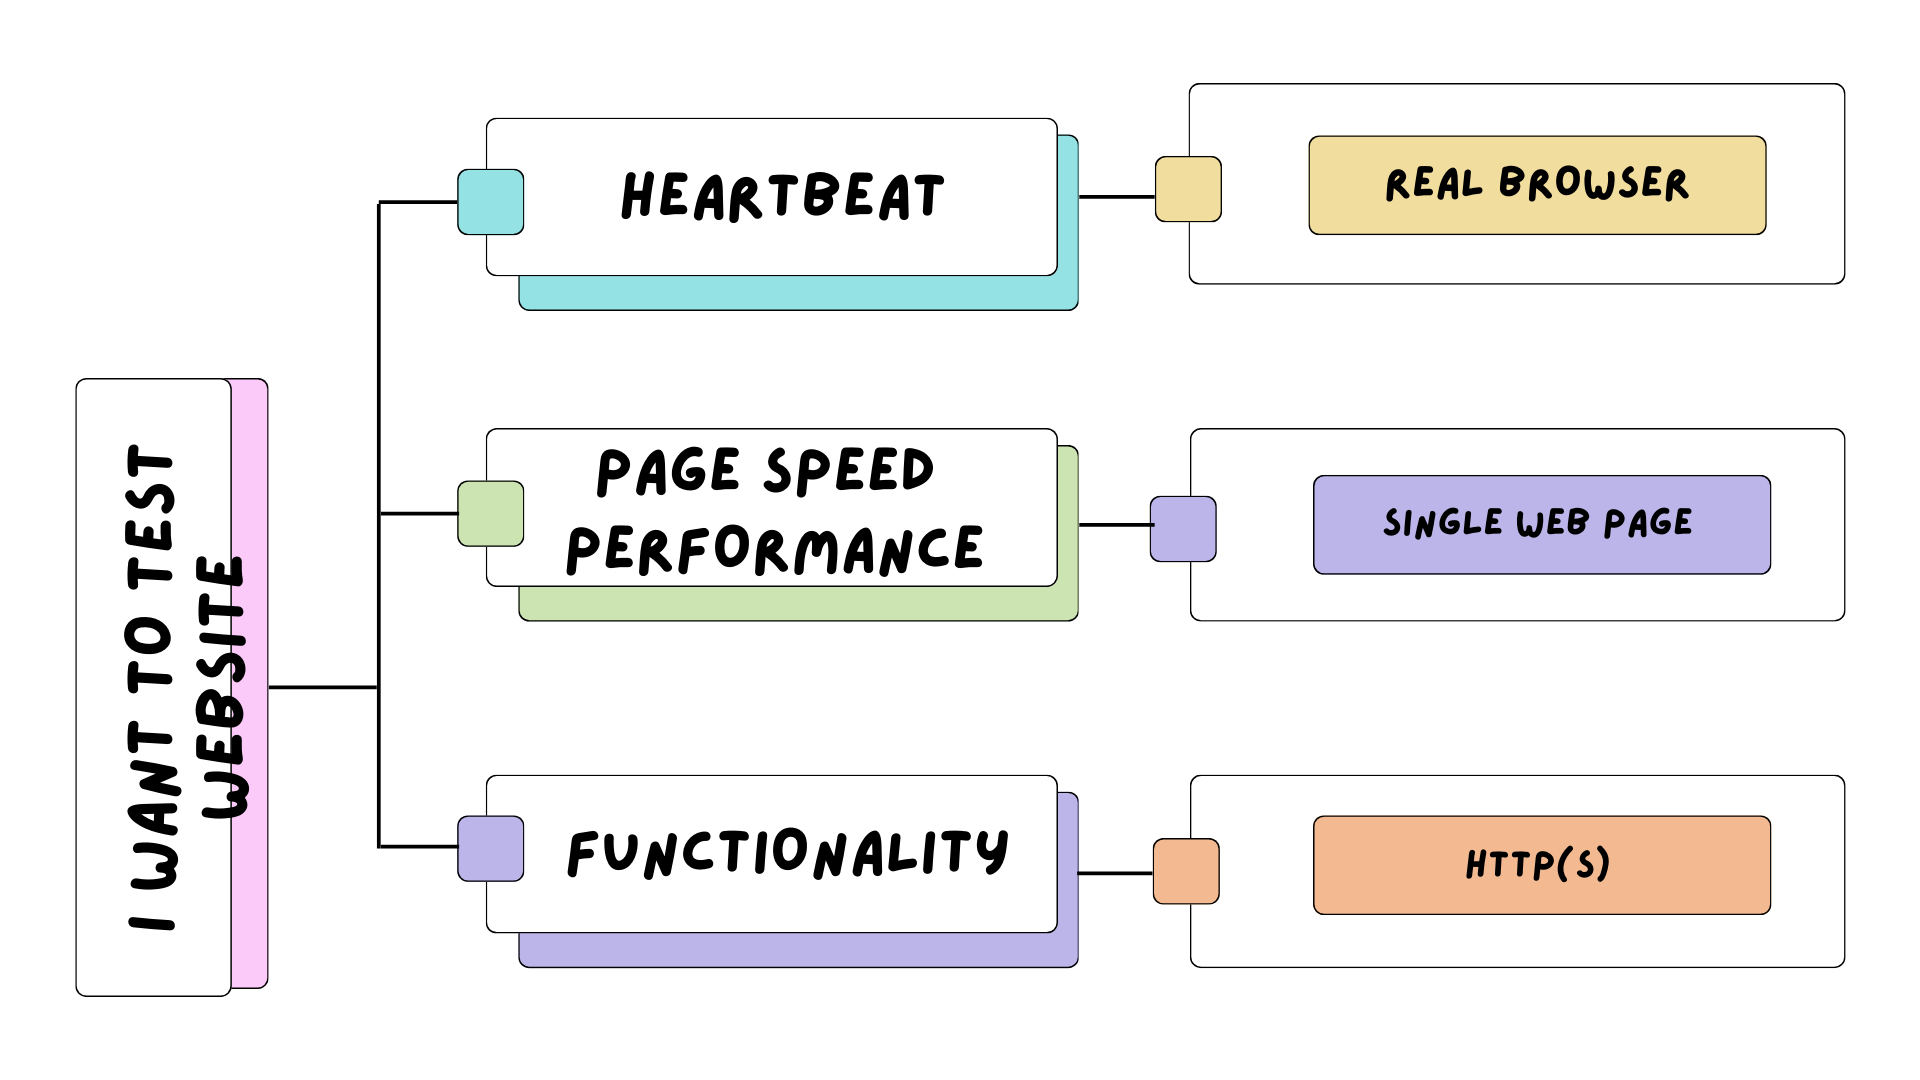
If you don’t require any sophisticated interaction with the web page you want to monitor, then you can go with a simplified version of website monitoring, called Single Web Page. It offers the same comprehensive approach to monitoring where the page is loaded in a real browser. Not only does that allow you to catch all types of errors (network issues, errors of the server, or errors that occur at the browser-level in JavaScript, for example), but monitor website speed as well. The only limitation is the ability to replicate user’s interaction with the web page. You cannot submit forms or browse to a different page within the same monitoring session.
If you’re interested in implementing continuous monitoring with Dotcom-Monitor, integrating Lighthouse into your web page monitoring routine is the perfect fit for this scenario. It allows you to continuously track and improve your website’s health, ensuring it remains accessible, and optimized over time. For additional details, read more here.
HTTP(S) Monitoring
If you want to focus on backend services and resource efficiency, opt for more lightweight and faster HTTP(S)-based monitoring. HTTP(S) monitoring focuses on the core functionality of your web services by examining the HTTP(S) requests and responses. This method is ideal for testing the availability and performance of backend services, APIs, and the server’s response to requests. It doesn’t render the page in a browser, so it doesn’t execute JavaScript, load CSS, or display images.
API — Web Services Monitoring
Another, more simple way to monitor your website is availability or uptime monitoring, verifying that your application is behaving correctly. In other words, if the goal is to monitor if your users can enter a specific URL and do not receive any type of page errors such as “Error 404: Page not found,” but reach the address and receive the expected responses, this type of monitoring is your best choice. This type of monitoring will not tell you if some part of your web page is not loading or not working, but this is the most cost-effective way of monitoring. For additional details, read more here.
Protocols — Internet Infrastructure Monitoring
There is also monitoring of web applications that may not have required a website or browser, but nevertheless, also serve some specific purpose (e.g. email, FTP, video streaming, etc.). They are usually referred to as “services” or may constitute part of internet infrastructure. For additional details, read more here.
Performance Counters — MetricsView
And finally, there are hardware servers where all the applications are working. What will happen if your server runs out of disk space, or an application consumes all the available memory? This can also lead to downtime of the server or your web page not working properly. Dotcom-Monitor has an answer to this as well. MetricsView is designed to monitor the state of different hardware resources on the server, or network devices such as switches or routers. For additional details, read more here.

