If you use variables in the imported collection, please see How to Work with Postman Environment Variables in Dotcom-Monitor.
Postman device returns the same monitoring results as the equivalent device created as a series of HTTP(S) tasks using the native Dotcom-Monitor interface. Dotcom-Monitor generates alerts and sends alert notifications on any error that occurs while the Postman Collection execution.
Note that to show an error on the response that does not meet specific validation criteria, add response validation to your Collection in Postman before you import it to Dotcom-Monitor (e.g., https://www.softwaretestinghelp.com/postman-assertions-automating-response-validation/).
If network errors are not your concern, you can configure the system to filter out this type of error in the Postman Collection settings (the Ignore Network Errors option).
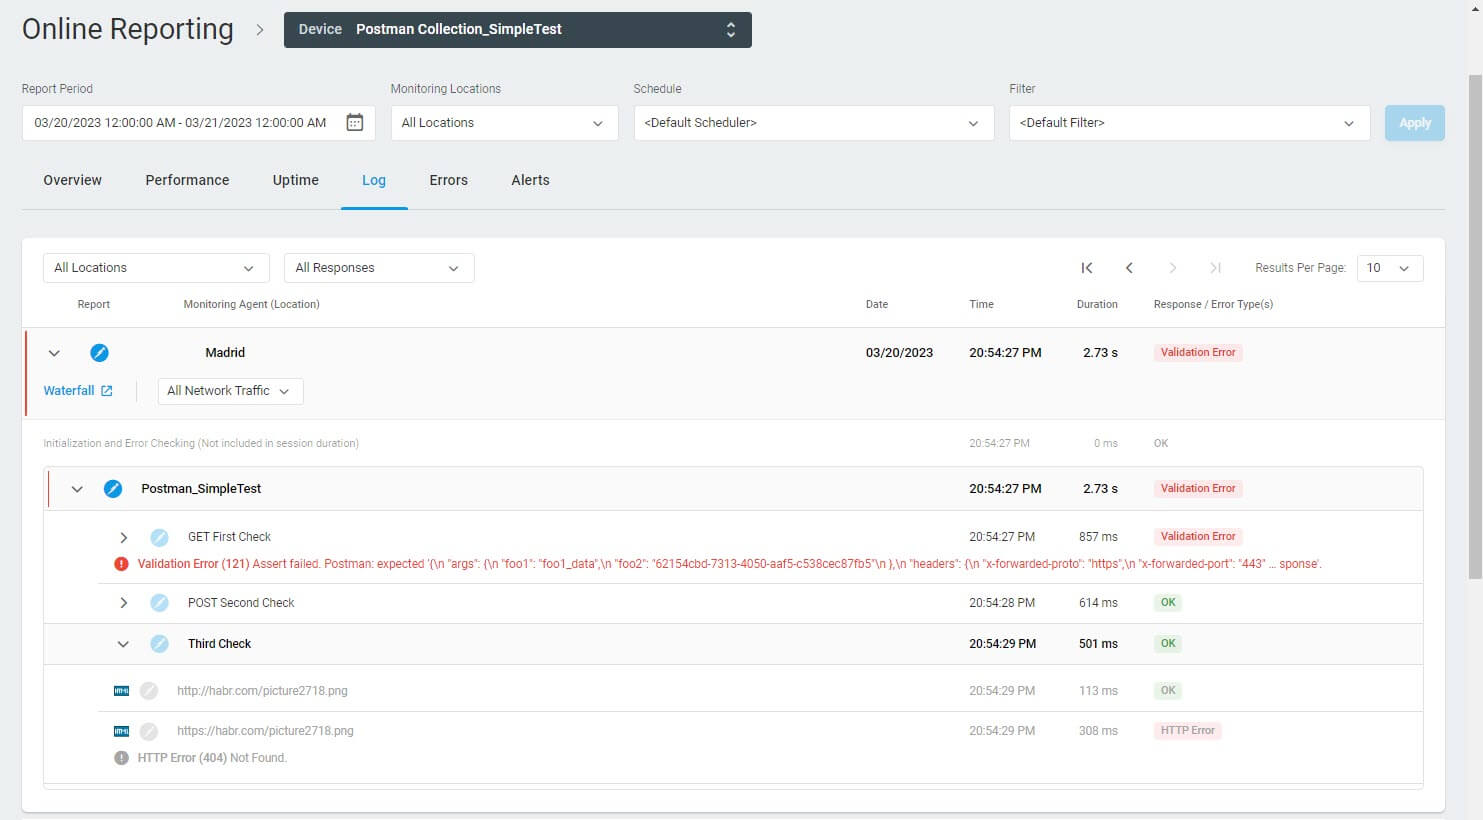
To see the response time breakdown by requests and response codes for each request in the collection, open your device Online Report for monitoring or Session Log for load testing.
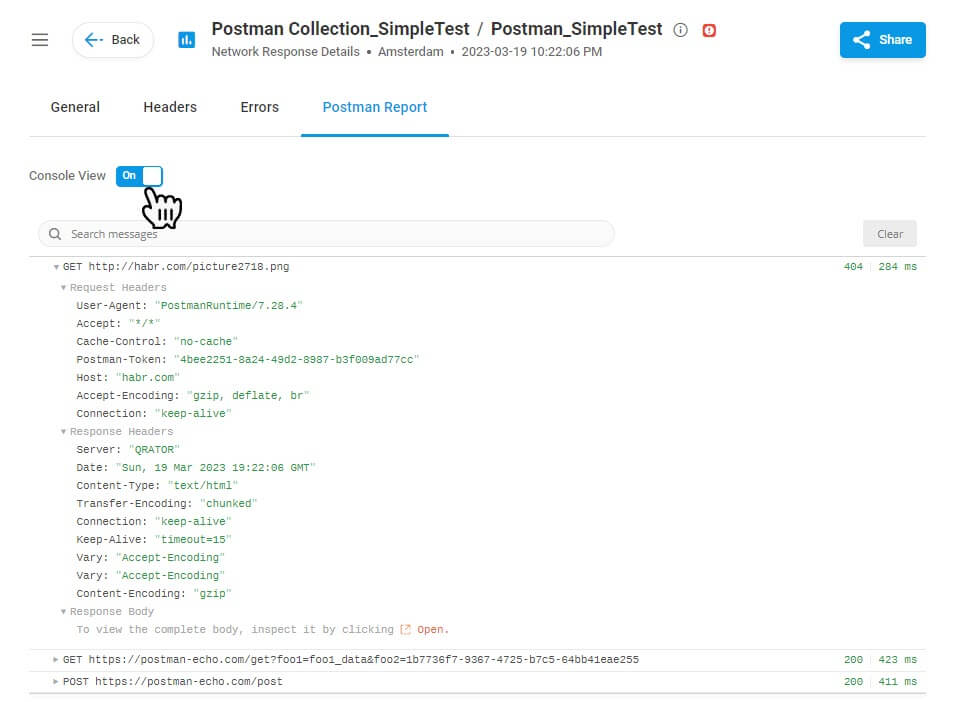
If you need to inspect the details of Postman Collection requests, for example, to troubleshoot requests, the Console View of the Postman Report is what you are looking for.
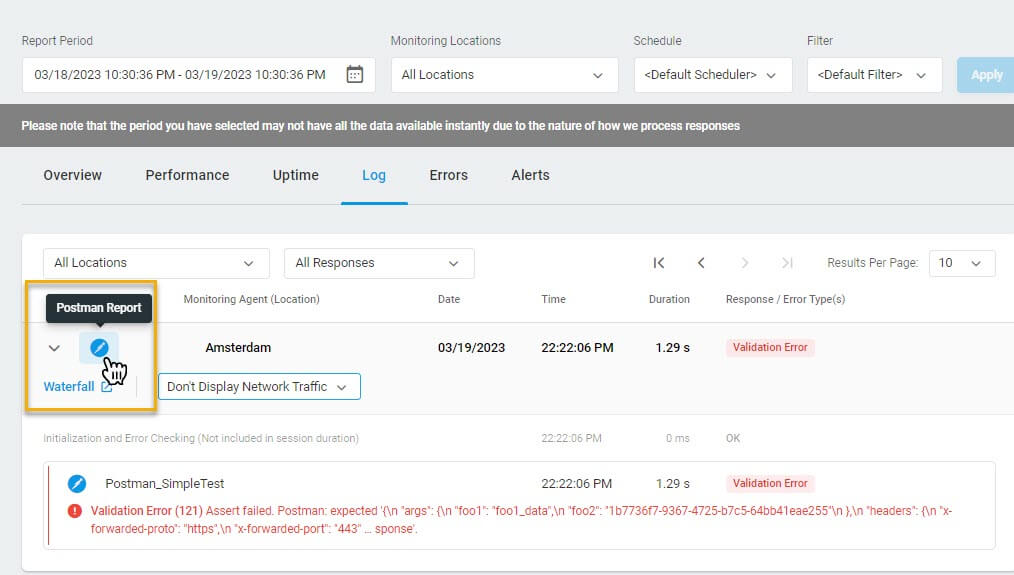
First, you will need to pull a detailed Postman Report from within your device Online Report.
For Load Testing, you can open a Postman Report from your load test Session Log.
Then you can switch the Postman Report to the Console View and study all the logged request details, such as request headers, variable values, response body, etc.
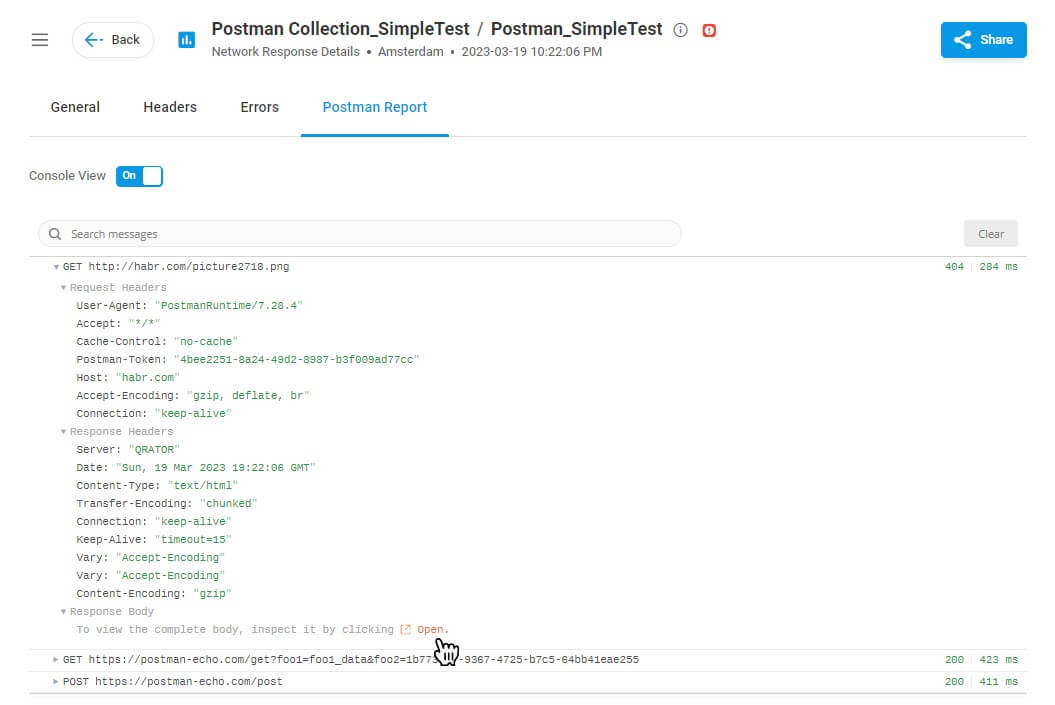
To see the response from the server to a Postman request:
- Open the corresponding Postman Report from within the device Online Report (for monitoring) or Session Log (for load testing).
- Switch to the Console View.
- Find the request you need to inspect and click the Open link in the Response Body section.


