
LoadView Goal-Based Load Test is a smart testing tool that provides testing against a target number of transactions, automatically adjusting all the necessary test parameters, such as user load and test duration.
In LoadView, a transaction represents a test script (test sample) that may include one or multiple user actions, such as navigating to a Contact Us page, filling out a form, and submitting it. The Transaction Goal represents the number of these transactions your site can handle per minute.
Test Algorithm Explained
To reach the desired number of transactions per minute and account for potential fluctuations in target server and application performance, LoadView executes a test in several cycles. This iterative process continues until the predetermined Test Duration elapses.
During each cycle, the system performs the following steps.
1. Start User Load calculation (only in the first cycle)
To match the specified Transaction Goal, the initial number of concurrent users is calculated based on the set Transaction Goal and the response time measured for the single-user test run executed during test validation:
Start User Load = Transaction Goal per minute × Validation Response Duration
2. Load generation
The system generates virtual user load based on the calculations.
3. Assessment of the achieved number of transactions per minute vs. Transaction Goal
Upon completing the first test cycle, the system calculates the actual number of transactions per minute for the cycle. Then the system checks if the generated number of concurrent virtual users matches the desired Transaction Goal, given the average response duration in the current cycle (Avg. Response Duration).
If this number does not match the desired Transaction Goal, the User Load for the next cycle is adjusted using the formula:
User Load = Transaction Goal per minute × Avg. Response Duration
Where the Avg. Response Duration is calculated as the average response time measured for the current cycle. To ensure accuracy, the test script is executed multiple times within each cycle, with the number of executions defined by the Adjustment Rate test parameter.
Real-life Example
To explain how it works in real life, let’s look at the report below where the Transaction Goal is set to 2,000 transactions per minute (TPM) and the validation response duration of 0.18 sec.
The recommended starting user load for the first cycle is calculated as:
Start User Load = 2000 TPM × 0.18 sec = 377 concurrent virtual users.
First Cycle: Initial Assessment
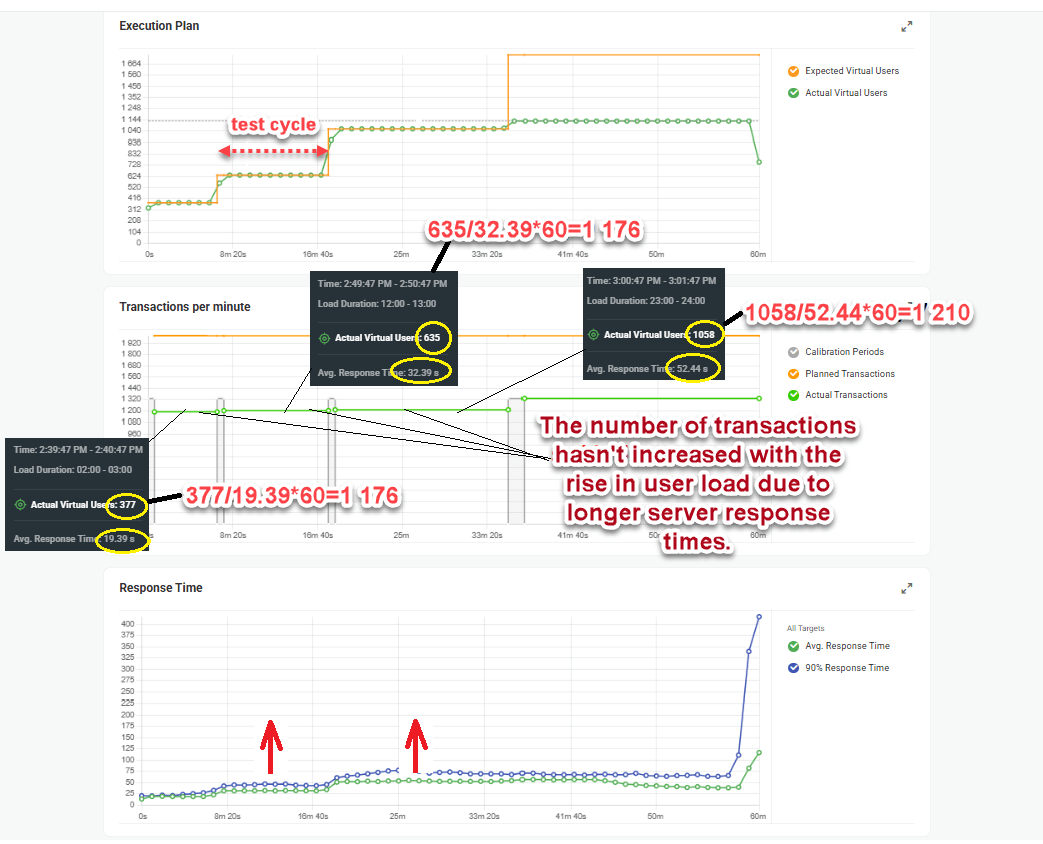
In the first test cycle, LoadView achieved 1,176 TPM, falling short of the 2,000 TPM goal. The average response time (Avg. Response Duration) recorded was 19.39 seconds. Based on this data, the system recalculates the required user load for the next cycle using the formula:
User Load₂ = (2,000 / 60) × 19.39 ≈ 646 concurrent virtual users
Second Cycle: Adjusting User Load
In the second cycle, the user load increased to 646 concurrent virtual users. However, the target server response time began to rise (as indicated by the first arrow on the Response Time chart). This increase led to a higher Avg. Response Duration of 32.39 seconds.
Despite the increased user load, the system still achieved only 1,176 TPM. This indicates that the transaction rate did not improve with the additional load.
Third and Forth Cycles: Further Adjustments and Observations
LoadView recalculated the user load for the third cycle:
User Load₃ = (2,000 / 60) × 32.39 ≈ 1,079 concurrent virtual users
During the third cycle, the response time continued to grow proportionally with the increased user load. In the fourth cycle, the server response time continued to increase with the user load, following the trends observed in previous cycles. This pattern suggests that the server performance degraded as more users were added, preventing LoadView from reaching the desired Transaction Goal.
This example shows that a significant increase in response time, even with a higher user load, can indicate server or application performance issues that need to be addressed to achieve the desired transaction goal.