If you need to process specific web page information, such as JavaScript error and status codes or informational messages, you can enable the browser’s DevTools Console monitoring. By default, Dotcom-Monitor reports don’t include messages from the Console log.
To enable Console message monitoring:
- Right-click the script line, or step, after which the Console messages need to be monitored.
- From the context menu, select Validate > Console Output.
- Select one from the available output options:
- Raise Error – generates an error response if a message in the Console satisfies the filtering criteria.
- Log – adds the Console messages to the device report if the filtering criteria are met.
- Skip – excludes the messages from processing. The messages that satisfy the filtering criteria will be ignored in Console monitoring.
- Clear – adds the point that clears previously set filters.
- Specify the filtering criteria on the editing pane, located to the left of the script code area:
- Message type – specifies the message type that the selected output filter will be applied to. Select All to apply the filter to any type of Console message.
- Message mask – specifies the mask of a message text. Output filter will be applied only to the messages which contain a specified mask.
- URL mask – defines the mask of the web element URL related to the message. If the element URL contains the mask, the message will be processed while monitoring according to the filter.
- Message source – defines the source that caused the message to get logged to the Console.
The Console Output Filters are applied according to their position in the script. So, if you want to apply an output filter to an action in the script, add the filter before the line of the action which information you need to process. For example, in the picture below, the output filter set in the 26th line will not process information generated to the Console on the button click recorded in the 25th line.
In the case of any contradiction between the Output Filters, the filter that appears last in the script has the highest priority.
Example
In the monitoring script example above, all console informational messages will be skipped beginning after Step 3 until Step 5, while the script executes. Beginning in Step 5, all types of Console messages, including informational messages, will be logged into the device report.
How to find logged messages in the monitoring results
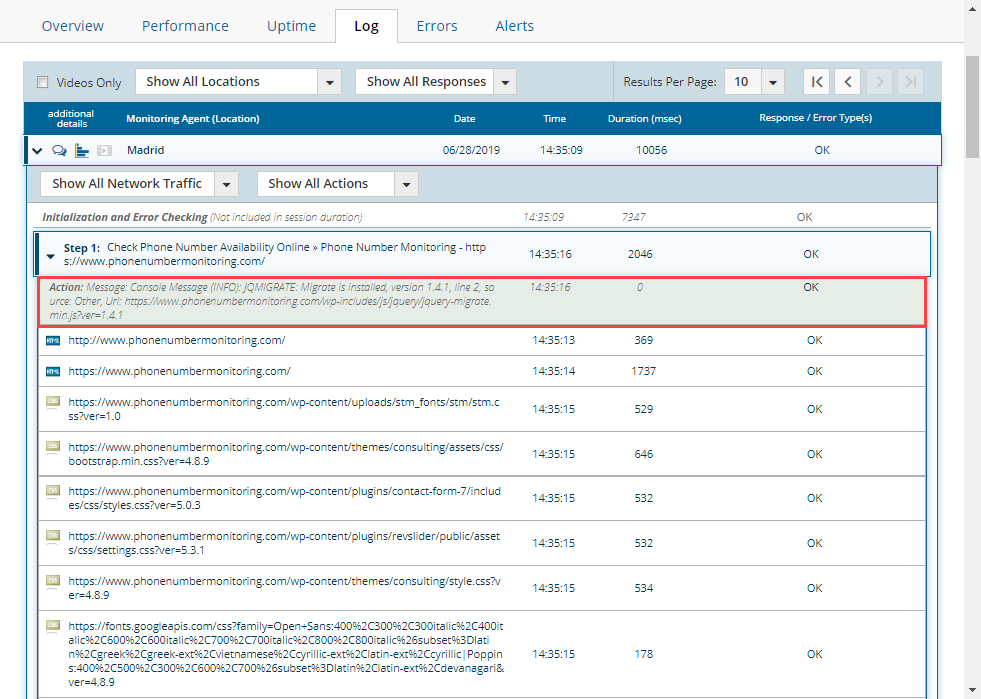
Once the Log output filter has been applied to the monitoring script, the Console messages are added to the Online Report log. To find the messages, go to Online Report > Log tab to view the details of the session steps. The messages will be listed in a step-detailed view. You can also view messages on the device’s Waterfall Chart.
Example
In the script provided below, the Log output filter is added at the beginning of Step 1. This means that all Console messages will be recorded in the session log.


