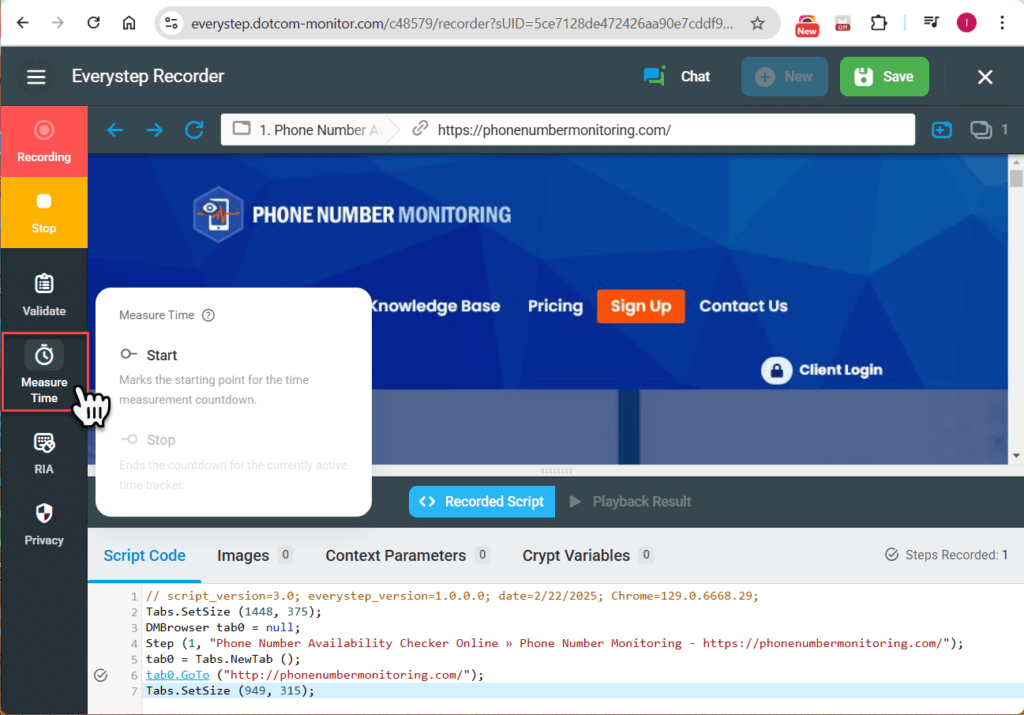
Similar to Network Watcher, Time Watcher measures the time of execution for a specified section of the script and generates an alert if the threshold has been exceeded.
Activating Time Watcher during Script Recording
You can start and stop Script Time Watcher from the Time Watcher menu on the left side toolbar of EveryStep Recorder while recording your script.
Using Time Watcher in Pre-recorded Script
To enable Time Watcher for the pre-recorded script:
- Right-click the line (step), after which Time Watcher should start measures.
- Select Measure Time > Script > Start.
- Right-click the line, after which the measurement must be stopped. Select Measure Time > Script > Stop, and choose the name of the watcher to close.
Configuring Time Watcher Custom Metric
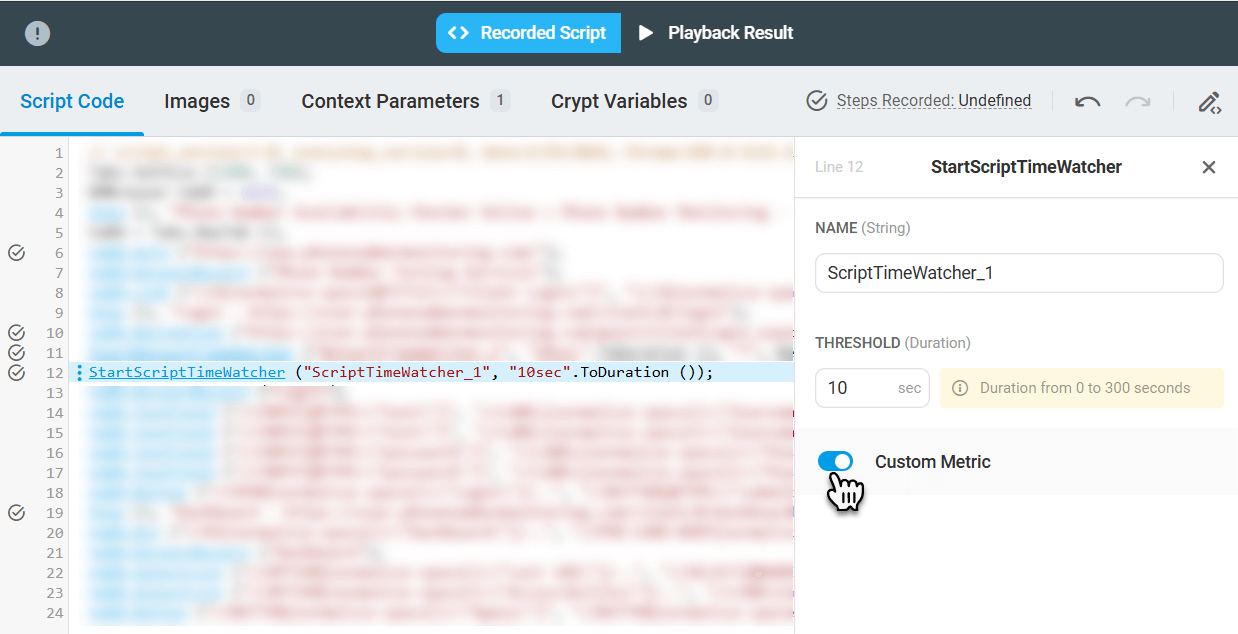
To collect, process and aggregate Script Time Watcher results as a custom metric, make sure to enable the Custom Metric option in the Time Watcher settings. Please visit the Custom Metrics in Web App Performance Monitoring and Load Testing article of our wiki to find more details on the custom metric analysis.
If you have been using the Time Watcher function in your load testing scripts and want to gather the watcher statistics based on all test sessions executed within the test, visit the Time Watcher Statistics article of this wiki.
To enable Time Watcher Custom metric for the pre-recorded script:
- Right-click the Time Watcher method in the script.
- On the editing pane located to the left of the script code area enable the Custom Metric option.


