Comprehensive Monitoring for
Websites, APIs, and Network Protocols
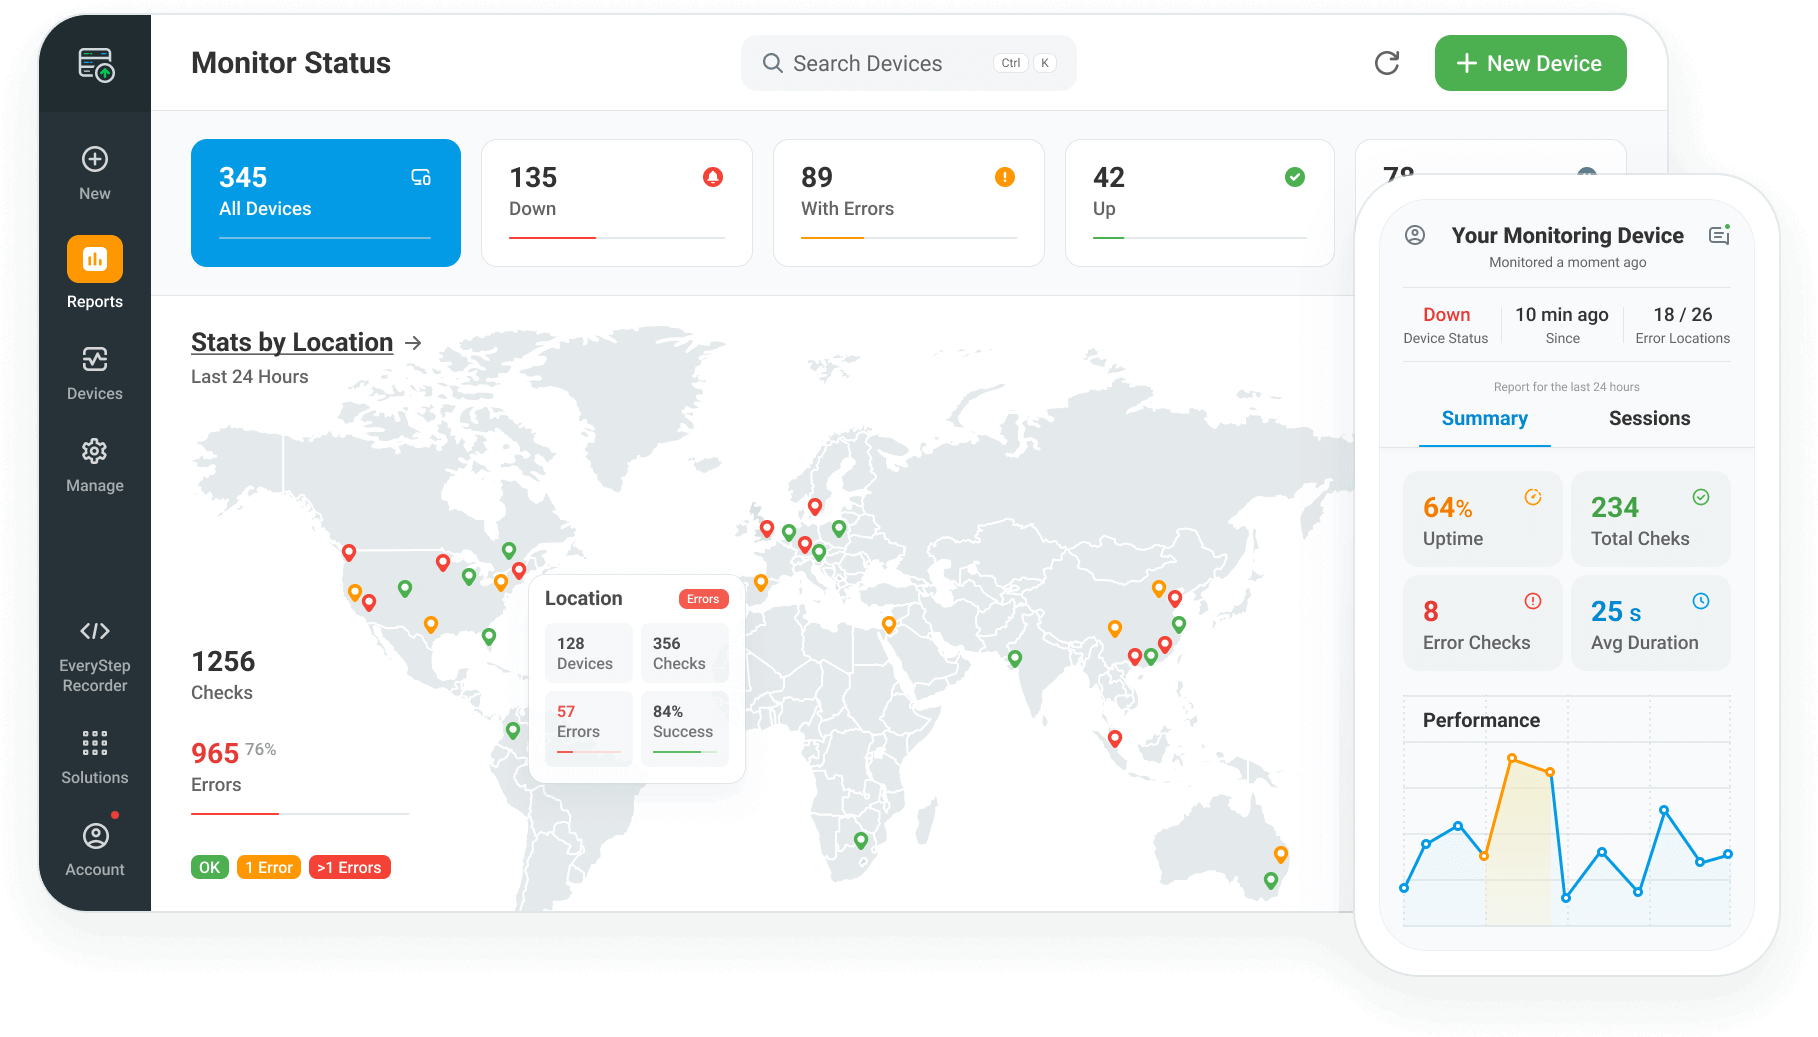
Get real-time insights into uptime, performance, and availability across all your critical systems. Detect issues before they impact users with our powerful monitoring solutions.
Comprehensive Monitoring for
Websites, APIs, and Network Protocols
Get real-time insights into uptime, performance, and availability across all your critical systems. Detect issues before they impact users with our powerful monitoring solutions.
Ensure seamless performance and reliability across your digital infrastructure. Start monitoring today and catch issues before they impact your business.