Top 10 Datadog Competitors & Alternatives in 2025
Last Updated: January 9, 2025
Contents
Top 10 Datadog Competitors & Alternatives in 2024
In the realm of IT infrastructure monitoring and analytics, Datadog has established itself as a market leader and is recognized in the observability and monitoring space. It offers a comprehensive Software as a Service (SaaS)-based platform that provides real-time insights into the performance and health of applications, networks, and infrastructure. By providing full-stack monitoring, which includes infrastructure monitoring, application performance monitoring (APM), log management, and network performance monitoring, Datadog helps organizations maintain high levels of availability and performance, and it provides the tools necessary for effective IT optimizations.
By offering a comprehensive cloud-based observability platform that provides real-time insights using full-stack monitoring and observability, Datadog has become a go-to solution for businesses seeking to optimize their digital operations. Other vendors offering obverservability monitoring platforms include IBM, Cisco, Microsoft, Sumo Logic, AWS, and LogicMonitor as examples.
As the demand for specialized monitoring tools continues to grow, several alternatives have emerged, each offering unique features and capabilities. One prominent competitor in this landscape is Dotcom-Monitor, distinguished for its notable offerings. In this article, we’ll explore the top 10 Datadog competitors and alternatives in 2024, analyzing their key features, pros, and cons to help you find the best fit for your monitoring needs.
Datadog Alternatives
1. Dotcom-Monitor
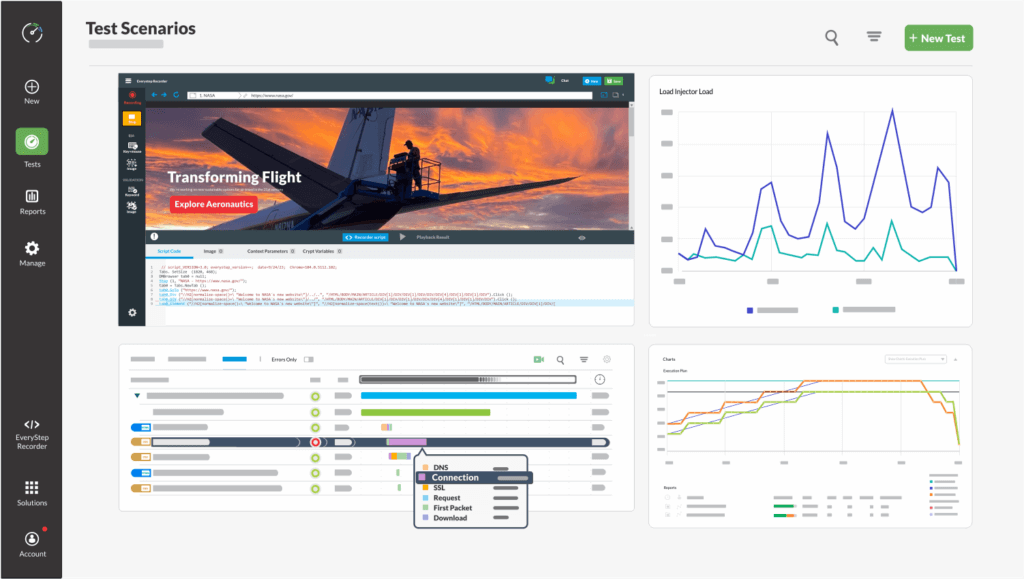
Dotcom-Monitor offers a comprehensive suite of monitoring tools tailored to meet the diverse needs of modern enterprises. One of its standout features is its global monitoring network, which provides extensive coverage across 30+ geographical locations, enabling organizations to gain insights into performance metrics from around the world. This global perspective allows businesses to identify regional variations in website or application performance, ensuring a consistent user experience regardless of location.
Dotcom-Monitor stands out as the go-to solution if your organization specifically seeks expertise in synthetic monitoring without the bulk of a full API suite. Specializing in synthetic monitoring, Dotcom-Monitor offers a focused approach to this critical aspect of application performance management (APM). While other providers may offer bloated and expensive suites that include features beyond your needs, Dotcom-Monitor hones in on synthetic monitoring with precision and depth.
By choosing Dotcom-Monitor for your synthetic monitoring needs, you benefit from a provider that dedicates its resources and expertise to perfecting this crucial component of APM. With advanced capabilities in simulating user interactions and virtual user journeys, Dotcom-Monitor excels at proactively identifying performance issues before they impact end users. This focused approach ensures that you receive unparalleled insights and actionable data specifically tailored to optimize your digital properties’ performance.
Real-time alerts and notifications are another key feature of Dotcom-Monitor. By setting up customized alerting, organizations can receive instant notifications when performance metrics deviate from expected norms. This enables your IT teams to respond swiftly to emerging issues, minimizing downtime, and mitigating potential impacts on user experience. Whether it’s an increase in page load times, a spike in error rates, or a drop in transaction completion rates, Dotcom-Monitor ensures that businesses are always informed and empowered to take proactive measures.
Furthermore, Dotcom-Monitor’s commitment to synthetic monitoring is reflected in its user-friendly interface, which streamlines the configuration, management, and analysis of monitoring data. This intuitive dashboard provides comprehensive visibility into synthetic monitoring metrics, empowering your teams to make informed decisions and drive continuous improvement in your digital experiences. When it comes to synthetic monitoring expertise without the unnecessary extras, Dotcom-Monitor emerges as the clear choice for organizations prioritizing performance and reliability. With Dotcom-Monitor, you can trust that your synthetic monitoring needs are in the hands of true experts dedicated to helping you achieve and maintain peak performance across your digital ecosystem.
Key Features
- Global monitoring network for comprehensive coverage.
- Synthetic monitoring for simulating user interactions.
- Built in recorder to record custom sequences and playback your scenarios
- Real browser testing to measure actual performance of your websites and apps
- Real-time alerts and notifications for proactive issue resolution.
Pros
- Specializing in synthetic monitoring, providing expertise in this aspect of an APM suite.
- Pricing tailored for synthetic monitoring solution, allowing you to avoid paying for unnecessary APM suite features.
- Access to white glove and enterprise services offered at a fraction of the cost compared to competitors.
Cons
- Lacks a full APM suite offering, focusing solely on synthetic monitoring.
- Absence of predictive AI analysis for anticipating and addressing infrastructure errors.
2. New Relic
New Relic specializes in application performance monitoring (APM) and observability solutions, providing deep insights into application performance, infrastructure, and customer experience. Its real-time monitoring capabilities and extensive integration make it a strong competitor in the market.
Key Features
- Application Performance Monitoring (APM): Monitor the performance of your applications in real-time, identify bottlenecks, and troubleshoot issues quickly to ensure optimal user experience.
- Infrastructure Monitoring: Gain visibility into the health and performance of your infrastructure, including servers, containers, and cloud services, to ensure reliability and scalability.
- Integration Ecosystem: Seamlessly integrate New Relic with your existing workflows and third-party tools, including popular DevOps and CI/CD platforms, to streamline monitoring and troubleshooting processes.
Pros:
- Real-time insights into application performance.
- Extensive integrations enhance workflow efficiency.
- User-friendly interface facilitates ease of use.
Cons:
- Limited support for infrastructure monitoring compared to Datadog.
- Pricing may be prohibitive for larger deployments.
3. Splunk
Splunk offers operational intelligence solutions for log management, security, and IT operations, leveraging powerful analytics to extract insights from machine-generated data. With its scalability and comprehensive security features, Splunk competes closely with Datadog.
Key Features
- Data Collection: Gather data from diverse sources, including logs, metrics, and events, regardless of format or source.
- Visualization and Reporting: Create interactive dashboards and reports to visualize trends, patterns, and anomalies in your data, facilitating informed decision-making.
- Machine Learning: Leverage machine learning algorithms to uncover hidden insights, predict future trends, and automate repetitive tasks.
Pros
- Powerful analytics enable actionable insights from machine data.
- Scalable architecture accommodates growing data volumes.
- Robust security features enhance threat detection and compliance.
Cons
- Steeper learning curve compared to Datadog.
- Pricing may not be suitable for smaller organizations.
4. Dynatrace
Dynatrace offers AI-powered observability solutions for application performance monitoring, infrastructure monitoring, and digital experience management. With its automatic discovery and dependency mapping, Dynatrace provides automation and actionable insights for optimizing digital experiences.
Key Features
- Automatic Discovery and Baselining: Automatically discovers and baselines all components and dependencies within dynamic environments, reducing manual configuration overhead.
- Real User Monitoring (RUM): Captures and analyzes user interactions with applications, providing insights into performance, user behavior, and business impact.
- AI-Powered Root Cause Analysis: Utilizes AI algorithms to pinpoint root causes of issues in real-time, accelerating debugging and fast problem resolution.
Pros
- AI-driven insights enhance proactive monitoring and troubleshooting.
- Automatic discovery simplifies infrastructure mapping.
- Support for cloud-native technologies ensures compatibility with modern environments.
Cons
- Pricing may be higher compared to other alternatives.
- Advanced features may require additional configuration.
5. Prometheus
Prometheus is an open-source monitoring and alerting toolkit designed for reliability and scalability, specializing in monitoring time-series data. With its scalable architecture and seamless integration with Kubernetes, Prometheus competes closely with Datadog in cloud-native environments.
Key Features
- Scalable and Reliable: Designed to be highly scalable and reliable, Prometheus can handle large-scale deployments and collect metrics from thousands of targets without a single point of failure.
- Pull-Based Architecture: Utilizes a pull-based architecture where Prometheus scrapes metrics from instrumented targets at regular intervals, allowing for real-time monitoring and alerting.
- Powerful Query Language: Provides a powerful query language called PromQL, which allows users to aggregate, filter, and manipulate time-series data to generate custom metrics and alerts.
Pros
- Scalable architecture accommodates growing data volumes.
- Rich query language enables flexible data analysis.
- Seamless integration with Kubernetes simplifies container monitoring.
Cons
- Lack of built-in features compared to Datadog.
- Setup and configuration may require expertise.
6. AppDynamics
AppDynamics offers application performance monitoring (APM) and observability solutions for modern applications. With its real-time visibility into application performance and user experience, AppDynamics helps organizations optimize their digital experiences.
Key Features
- Application Performance Monitoring (APM): Provides deep visibility into the performance of applications, including transaction tracing, code-level diagnostics, and end-user monitoring.
- End-User Monitoring (EUM): Captures real user interactions with applications across web and mobile devices, allowing organizations to track user experience metrics and identify areas for improvement.
- Dynamic Scaling: Automatically scales monitoring capabilities based on the dynamic nature of modern applications and infrastructure, ensuring consistent performance monitoring across changing environments.
Pros
- Comprehensive APM capabilities for modern applications.
- Real-time insights into application performance and user experience.
- Business impact analysis helps prioritize and resolve issues effectively.
Cons
- Pricing may be higher compared to some alternatives.
- Advanced features may require additional configuration.
7. Zabbix
Zabbix is an open-source monitoring solution known for its flexibility and scalability, offering a wide range of monitoring capabilities for networks, servers, applications, and services. While it requires more manual configuration, Zabbix’s customizable monitoring templates make it a popular choice among organizations seeking cost-effective solutions.
Key Features
- Flexible Monitoring: Monitor a wide range of devices and systems, including servers, network devices, virtual machines, and cloud resources.
- Customizable Alerts: Set up custom alert rules based on predefined thresholds or specific events to promptly identify and address issues.
- Community Support: Benefit from a vibrant user community and extensive documentation for troubleshooting and support.
Pros
- Cost-effective solution for organizations with limited budgets.
- Highly customizable to suit specific monitoring requirements.
- Active community ensures ongoing support and development.
Cons
- Requires more manual configuration compared to Datadog.
- User interface may not be as intuitive for beginners.
8. Grafana
Grafana is an open-source analytics and monitoring platform known for its rich visualization capabilities and extensibility. With its support for various data sources and active community, Grafana is a popular choice among organizations seeking flexible monitoring solutions.
Key Features
- Flexible Visualization: Offers a wide range of visualization options including graphs, charts, gauges, heatmaps, and tables, enabling users to create customized dashboards tailored to their specific monitoring needs.
- Data Source Agnostic: Supports integration with numerous data sources including Prometheus, Graphite, InfluxDB, Elasticsearch, MySQL, PostgreSQL, and more, allowing users to consolidate metrics from diverse sources into a single platform.
- Community and Ecosystem: Benefits from a vibrant community of users and contributors who actively develop plugins, integrations, and extensions, extending Grafana’s functionality and interoperability with other systems.
Pros
- Rich visualization capabilities enhance data insights.
- Versatile platform supports diverse data sources.
- Active community ensures continuous support and development.
Cons
- Requires additional plugins for certain monitoring features.
- Configuration may be complex for beginners.
9. SolarWinds
SolarWinds is a trusted provider of powerful and user-friendly IT management software, designed to simplify and enhance the monitoring and management of IT infrastructure. With a comprehensive suite of solutions, SolarWinds empowers IT professionals to effectively monitor, manage, and secure their networks, applications, servers, and more.
Key Features
- Network Monitoring: Monitor the performance and availability of network devices, including routers, switches, firewalls, and wireless access points, to ensure optimal network performance.
- Server Monitoring: Keep tabs on server health, performance, and resource utilization to proactively identify and resolve issues before they impact users or business operations.
- Integration Ecosystem: Integrate SolarWinds with third-party tools and services, such as ticketing systems, collaboration platforms, and cloud services, to extend its functionality and enhance workflow efficiency.
Pros
- Comprehensive suite of monitoring solutions.
- Scalable architecture accommodates growing infrastructure.
- Intuitive interface enhances usability.
Cons
- Pricing may not be competitive for smaller organizations.
- Integration between modules may be improved.
10. Instana
Instana is an advanced platform that provides comprehensive monitoring and analytics capabilities for dynamic microservices and cloud-native applications. With its automated approach to monitoring, Instana empowers organizations to gain deep insights into their applications and infrastructure, streamline troubleshooting, and optimize performance.
Key Features
- Continuous Application and Infrastructure Monitoring: Continuously monitors applications, microservices, containers, Kubernetes, and cloud infrastructure in real-time, capturing performance metrics and traces.
- End-to-End Tracing and Distributed Tracing: Provides end-to-end tracing and distributed tracing capabilities, allowing users to trace requests across complex distributed systems and identify latency bottlenecks.
- Code-Level Visibility: Offers code-level visibility into application performance, including method-level insights, database queries, and external service calls, enabling developers to pinpoint performance issues in the codebase.
Pros
- Automatic setup and configuration for rapid deployment.
- Deep insights into cloud-native application performance.
- Seamless integration with Kubernetes and other container orchestration platforms.
Cons
- May not provide as comprehensive infrastructure monitoring as Datadog.
- Pricing may vary based on usage and deployment size.
Wrapping It Up: Finding the Ideal Datadog Alternative
In conclusion, selecting the best monitoring solution depends on your organization’s specific requirements, budget constraints, and technical expertise. While Datadog and its competitors offer a wide range of monitoring solutions, Dotcom-Monitor stands out as a top contender for organizations seeking comprehensive performance monitoring capabilities. Here is why choosing Dotcom-Monitor may be the best decision for your business:
- Global Monitoring Network: Dotcom-Monitor’s extensive global monitoring network provides unparalleled visibility into performance metrics from around the world. This level of coverage allows businesses to identify regional variations in performance and ensure a consistent user experience across all geographical locations.
- Advanced Synthetic Monitoring: With its advanced synthetic monitoring technology, Dotcom-Monitor empowers organizations to proactively detect and resolve performance issues before they impact end-users. By simulating user interactions with web applications, Dotcom-Monitor can identify performance bottlenecks, latency issues, or downtime, enabling businesses to take preemptive action to maintain optimal performance.
- Real-Time Alerts and Notifications: Dotcom-Monitor’s real-time alerting system ensures that organizations are promptly notified of any deviations from expected performance metrics. By setting up customized alerting thresholds, businesses can receive instant notifications when issues arise, allowing them to respond swiftly and minimize downtime.
- User-Friendly Interface: Dotcom-Monitor offers a user-friendly interface that makes it easy for organizations to configure, manage, and analyze their monitoring data. Its intuitive dashboard provides comprehensive visibility into performance metrics, enabling users to gain actionable insights and optimize digital experiences effectively.
- Cost-Effective Solution: Compared to some of its competitors, Dotcom-Monitor may offer more competitive pricing options, making it an attractive choice for organizations with budget constraints. With its robust feature set and cost-effective pricing, Dotcom-Monitor delivers exceptional value for businesses of all sizes.
- Professional Support: Need help with anything related to your monitoring efforts? Dotcom-Monitor provides 24/7 expert assistance for any problems that you run into, or any help required.
Evaluate each option carefully based on factors such as scalability, ease of use, pricing, and integration capabilities to find the best fit for your monitoring needs in 2024. If you’re looking to monitoring your apps and services in real time, start monitoring for free with Dotcom-Monitor!


Solutions
Menu
Free tools
Menu
Company
Menu


- 1-888-479-0741
- sales@dotcom-monitor.com
- Minneapolis, MN, USA
Company
RESOURCES
Menu
WEB SERVICES
Menu
INFRASTRUCTURE MONITORING
Menu
Solutions
Our Other Platforms
Free Tools
© 1998-2025 Dotcom-Monitor, Inc. All rights reserved.