- 1-888-479-0741
- sales@dotcom-monitor.com
- Minneapolis, MN, USA
New Relic Alternatives
Unsure which option is best for you? No problem! We’ve reviewed several New Relic alternatives, and in this guide, we’ll compare Dotcom-Monitor to New Relic.
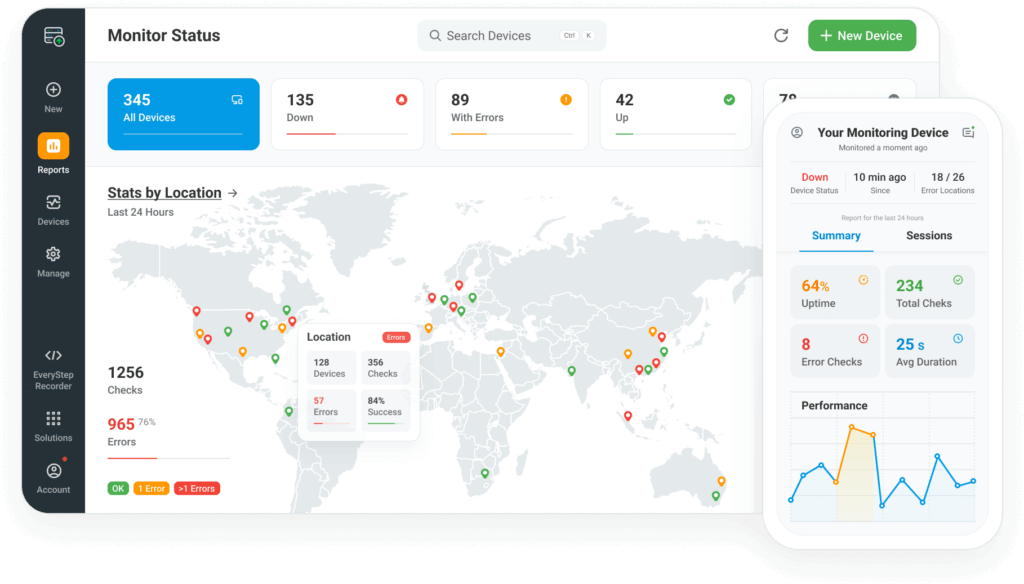
The Dotcom-Monitor platform gives you the features you need to ensure uptime, performance, and availability on a global scale.
Real Browsers
Measure performance within real desktop browsers like Chrome, Firefox, and Internet Explorer.
Global Monitoring
Understand user performance from nearly 30 global locations.
.
Point and Click Scripting
Record custom scripts to monitor website and web application elements.
Full End-to-End
Monitoring Offerings
Choose the monitoring solution that best suits your needs.
A Comprehensive Comparison
Choosing the right monitoring tool for your business can be challenging, especially when comparing two powerful platforms like Dotcom-Monitor and New Relic. Both offer robust monitoring solutions but cater to different needs and priorities. Dotcom-Monitor stands out for its focus on website, server, and network monitoring, with an emphasis on real browser testing and global uptime tracking. New Relic, on the other hand, excels in providing a look into application performance management (APM) which might make it ideal for organizations focused on monitoring backend systems and application performance.
Some of Dotcom-Monitor’s standout features include its global network of monitoring locations, real browser testing, and protocol monitoring and these are areas where New Relic doesn’t have the same capabilities. Meanwhile, New Relic’s strengths lie in its robust APM capabilities which include advanced metrics and detailed insights for application-level monitoring.
This comprehensive breakdown highlights the unique value each platform brings and enables you to make an informed choice based on your organization’s specific requirements. You can view our table below to get a better understanding of the features between Dotcom-Monitor, New Relic, and Other Monitoring Tools.
Features | Dotcom-Monitor | New Relic | Other Monitoring Tools |
|---|---|---|---|
Real Browser Monitoring | |||
Website Uptime Monitoring | |||
Transaction Monitoring | |||
Server Performance Monitoring | |||
Global Monitoring Locations | |||
API Performance Monitoring | |||
Web Services Monitoring (SOAP, REST, etc.) | |||
Network & Protocol Monitoring | |||
Real-Time Alerts | |||
SLA Monitoring & Reporting | |||
On-Premise Monitoring Options | |||
Load Testing |
New Relic is a trusted name in performance monitoring that helps businesses stay on top of uptime, performance, and user experience. With its easy-to-use interface and versatile features, it’s a go-to choice for teams looking for a simple yet powerful way to keep your applications running smoothly.
Dotcom-Monitor offers an even broader set of tools for those who need deeper insights into websites, applications, networks, and APIs. It’s a perfect fit for businesses, big or small, that want advanced website monitoring, detailed reports, and customization options to meet their unique needs. Whether you’re a small startup or a large enterprise, both platforms have something special to offer to keep your systems performing at their best.
Compare New Relic Pricing vs. Dotcom-Monitor
When it comes to pricing, Dotcom-Monitor and New Relic cater to different needs. Dotcom-Monitor is known for its cost-effectiveness, offering flexible pricing plans that scale based on the number of monitoring targets. It provides a 30-day free trial which allows businesses to experience all the features before committing. Dotcom-Monitor’s pricing structure is particularly attractive for businesses looking for comprehensive monitoring solutions without breaking the bank. In contrast, New Relic also offers a free tier, but it’s pretty limited, especially for larger teams or businesses that require advanced features. As you scale, New Relic’s pricing also increases with its enterprise plans often coming at a higher cost. For businesses with extensive monitoring needs, Dotcom-Monitor tends to be more budget-friendly.
Compare New Relic User Experience vs. Dotcom-Monitor
In terms of user experience, both Dotcom-Monitor and New Relic aim to provide smooth, intuitive platforms, but they cater to different user bases. Dotcom-Monitor excels with its easy-to-navigate interface and simple setup which makes it ideal for both technical and non-technical users. The platform offers customizable dashboards and detailed reports that are easy to interpret that provide actionable insights with minimal hassle. Additionally, Dotcom-Monitor’s global monitoring makes it easy to track performance in real time across different regions. New Relic, while feature-rich, can feel more complex. This is particularly true for new users or those without a technical background. Its extensive capabilities are great for advanced users but may come with a steeper learning curve compared to Dotcom-Monitor’s straightforward design.
Compare New Relic Customer Support vs. Dotcom-Monitor
Customer support is another key area where Dotcom-Monitor shines. It offers 24/7/365 customer support through email, live chat, and phone to ensure that their users can always get the help they need. Enterprise customers benefit from dedicated account managers who provide personalized assistance throughout their journey. Dotcom-Monitor also provides free onboarding and training to help users get the most out of the platform. New Relic also offers 24/7 support. While New Relic has an extensive knowledge base and community forums, users may find the self-service resources harder to navigate and this is especially apparent when compared to Dotcom-Monitor’s more personalized approach. Overall, Dotcom-Monitor’s hands-on support is a major plus for businesses that value a close and responsive customer service.
Why Choose Dotcom-Monitor
The Dotcom-Monitor platform consists of six main individual monitoring solutions. Each solution allows you to set up checks as frequently as every minute and includes benefits like detailed dashboards, multi-user support, SSO integration, reports, 24/7/365 support, and more.
The Dotcom-Monitor platform also supports the load and stress testing solution, LoadView. You can easily conduct and manage all your performance monitoring and testing initiatives from one single platform. It allows you to seamlessly transition from load testing your software straight to monitoring the longevity of your software in real time with both LoadView and Dotcom-Monitor.
Web Services Monitoring
$1.99/month per target (minimum of 10 targets required). Monitoring features include the following:
- 1-5 minute check frequency
- HTTP/S
- Web Server
- Web API – SOAP/REST
- ICMP/Ping
- SSL certification checks
Web Page Monitoring
$5.99/month per page (minimum of 5 pages required). Monitoring features include the following:
- 1-180 minute check frequency
- Real browsers (Chrome, Internet Explorer, Firefox)
- Desktop/mobile/tablets
- Detailed waterfalls
- Video capture
- DOM element timings
- Element trend reporting
- Content validation
- DNS/SSL/Connect breakdown
Web Application Monitoring
$7.79/month per step (minimum of 5 steps). Monitoring features include the following:
- 1-180 minute check frequency
- EveryStep Web Recorder (web-based scripting tool)
- Chrome/Internet Explorer playback
- Desktop/mobile/tablets
- Playback video capture
- Detailed waterfall charts
- Image/content validation
- Support for dynamic web applications, such as Flash, Silverlight, AJAX, and more
Infrastructure Monitoring
$7.99/month per target (minimum of 5 targets). Monitoring features include the following:
- 1-180min check frequency
- Streaming media servers
- Email servers
- DNS
- Traceroute
- FTP
- VoIP/SIP
- DNS Blacklist
- Telnet/Port check
All Monitoring
Each solution comes standard with the following benefits/features:
- Access up to nearly 30 monitoring locations
- 24/7 Support
- Data retention for 3 years
- Unlimited public dashboards
- Multi-user support
- Configuration API
- Real-time XML data feed
- SSO integration
- Unlimited PDF reports
- Third-Party integrations
The platform also supports the load and stress testing solution, LoadView. Manage all your performance monitoring and testing requirements from one single interface.
Want to try out the Dotcom-Monitor tools before you buy? Select from 10 free tools you can try before moving into the full platform. Everything from testing your website’s speed and web server performance to DNS blacklist and traceroute checks.
New Relic vs. Dotcom-Monitor Wrap Up
Both New Relic and Dotcom-Monitor are excellent choices for monitoring, but they shine in different areas. If you’re focused on tracking how your websites and applications are performing behind the scenes and need deep insights into your systems, New Relic is a good option. It’s packed with advanced features for those who want to dig into the technical details.
Dotcom-Monitor is all about versatility and ease of use. Whether you’re keeping an eye on websites, networks, or APIs, it covers a lot of ground with an intuitive interface that doesn’t require a steep learning curve. Plus, its global monitoring, real browser testing, and customizable reports make it ideal for businesses that need comprehensive monitoring without breaking the bank.
At the end of the day, the right choice depends on your needs. If you’re looking for a powerful yet easy-to-use tool with excellent customer support and flexible pricing, Dotcom-Monitor is a great fit. But if you’re after application performance insights and don’t mind a bit more complexity, New Relic is a strong contender. Both tools offer unique strengths to help your business stay on top of performance.
Compare Industry Monitoring Tools
Try the full Dotcom-Monitor platform free.

