Most websites that exist today rely on third-party elements in one form or another. For example, there are many services to gather analytics about site traffic such as Google analytics, but in order to work properly they require you to load a small script as a part of each web page like www.google-analytics.com/analytics.js. This is a small JavaScript file that is called when a page loads. This JavaScript file enables Google to record user traffic throughout a website. Most of the time, this file loads very quickly and efficiently, and often times it is already cashed on the local browser because it is such a common file, but if something ever goes wrong with the servers hosting the script, it could end up negatively impacting the page load speeds of your website.
There are a number of reasons that you may use data or files hosted on third party servers, perhaps the files or scripts are updated often and you want to be sure that you have the latest version. Maybe the scripts help gather data for you like Google analytics does. Perhaps you are trying to optimize page load speed for all users in diverse geographic locations by using a Content Distribution Network (CDN).
Monitoring CDN Performance
Content Distribution Networks are typically very large organizations with servers in many data centers around the world, usually very near or even in the internet backbone facilities. When an end user requests content hosted by a CDN, the request is routed to the CDN server closest to the user which could cut out thousands of milliseconds of transfer time for each element on the page as the number of hops across the internet are greatly decreased.
CDN Service Level Agreements (SLAs)
When you are paying a CDN to host your website content it is in your best interest to make sure they adhere to the promised SLAs. The bottom line is that you will lose site visitors if the site is not performing as fast as possible, or if the content is failing to load. Dotcom-Monitor has over 23 locations around the world from which you can monitor the performance of your CDN hosted content. There are SLA reports you can generate to view the availability of CDN hosted content with the help of content filters to focus in specifically on the CDN hosted elements.
Using Images from the Web
Referencing content such as images on external servers also serves to limit bandwidth usage on your own servers because the content is not pulled across the internet from your server but from the hosting server. This has been a popular tactic for small websites with limited budgets, but this technique can also have it’s drawbacks. If the original host of the image ever changes the image, you may unwittingly end up displaying a different image that you did not intent for your users to see.
Third-Party Content Monitoring Tools
The Dotcom-Monitor suite of monitoring tools includes several helpful tools for monitoring page and element load speeds as well as diagnosing problems after an issue has been detected.
Using BrowserView to monitor specific third-party content is as simple as setting up a monitoring task, and adding a domain based network element filter. You can set up a filter to monitor very specific elements or you can setup a more broad filter to monitor any elements from a specific domain or subdomain.
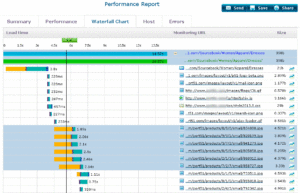
Diagnosing Slowdowns and Issues Using Waterfall Charts
Sometimes a website load speed may slow down dramatically, but on an intermittent period. This is an issue because it is hard to see the cause of the problem and diagnose it. With website monitoring we capture many different components of page load speed down to the individual elements.
There are a number of steps in the process of downloading each element. First the browser must resolve the DNS record to an IP address, next a connection must be successfully made to the hosting server. If the elements are secured it must negotiate the SSL certificate. Next it sends the requests for the individual elements and waits to receive the first packet in response. Finally, there is the time it takes to completely download each element. Each of these steps are individually recorded and displayed in the detailed waterfall chart, so that you can see at a glance the most problematic elements and figure out where in the process the element is having trouble.
If you receive reports where your site is slowing down on a seemingly random basis, it’s worth your while to find one of those periods and open up a waterfall chart for that timeframe. From here you can quickly see if any third-party elements are the cause of the slowdown. Waterfall charts are a good tool for visualizing load dependencies- for example, if you place a JavaScript file at the head of your html document, the browser may wait until the entire .js file has downloaded before continuing on to the next content on the site. If this script happens to be hosted by a third party, they could very well be slowing down all of the content hosted on your own server because of this loading dependency. In many cases this can simply be fixed by placing the scripts at the end of the content rather than the beginning. If it becomes a frequent issue, you may want to consider an alternative to the third-party host of that particular content.

