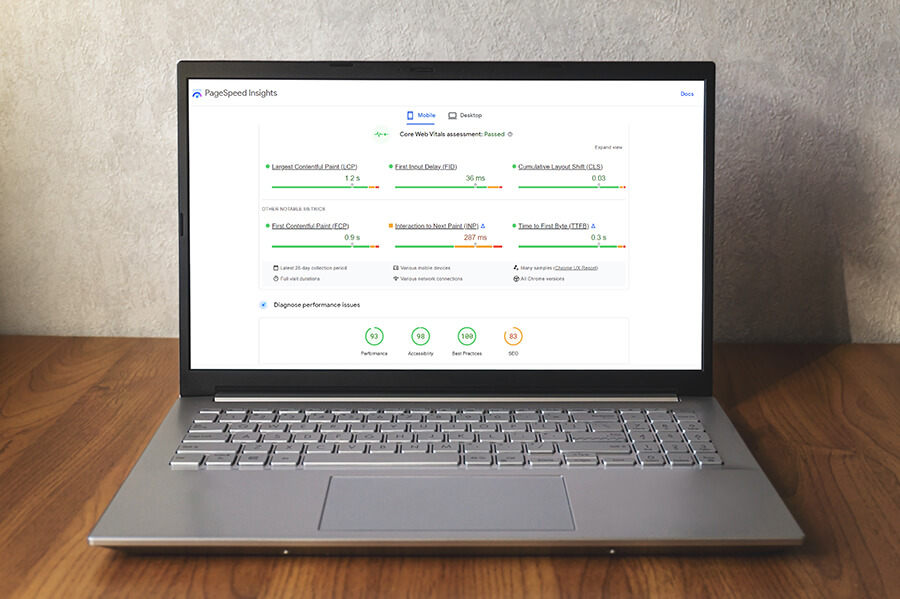
Website speed is super important and not just for keeping visitors happy, but also for doing well in search engine rankings. That’s where Google PageSpeed Insights comes into play. It’s a free powerful tool that helps you check how your website performs and gives you easy-to-follow tips for making it faster. In this updated guide, we’ll walk you through the latest best practices and show you how to use Google PageSpeed Insights to give your website a performance boost!
What is Google PageSpeed Insights?

Google PageSpeed Insights (PSI) is a tool created by Google to analyze the performance of web pages. It evaluates both the mobile and desktop versions of a website to provide you with a detailed breakdown of various performance metrics. PSI rates your site’s performance on a scale from 0 to 100. The higher the score, the better your website performs in terms of speed and user experience.
The tool also offers specific suggestions on how to improve your site’s speed, such as optimizing images, eliminating render-blocking resources, or leveraging browser caching. More importantly, PSI incorporates Core Web Vitals which is a set of metrics that focus on the critical aspects of user experience, including loading time, interactivity, and visual stability. With this tool, we can better understand how a website performs on different devices and networks.
The Importance of Page Speed Optimization
Web page loading speed is super important for a bunch of reasons. First, it directly impacts user experience and people love fast-loading sites. When you have fast loading sites, users are more likely to stay engaged, while slow sites can frustrate visitors and make them leave. It also plays a big role in search engine rankings since search engines like Google give priority to faster sites which can boost your visibility and bring in more organic traffic. With mobile browsing on the rise, speed is even more critical to ensure a smooth experience on smartphones and tablets. Plus, faster websites often lead to better conversion rates which means more sales and leads, while slower ones can cause potential customers to bounce. And, of course, a fast website gives you a competitive edge by offering a better overall experience to keep your users coming back!
Google PageSpeed Insights Features
Google PageSpeed Insights is packed with features that make it easy to understand and improve your website’s performance. Let’s look at what makes this tool so helpful:
- Performance Score: After running an analysis, Google PageSpeed Insights gives your site a performance score from 0 to 100. It’s a quick and easy way to see how well your site is doing. With anything above 90, it shows your site is in great shape.
- Core Web Vitals: The tool measures three key factors: Largest Contentful Paint (LCP) for loading speed, First Input Delay (FID) for how quickly users can interact, and Cumulative Layout Shift (CLS) for page stability. These are all part of Google’s Core Web Vitals which play a big role in both user experience and search engine rankings.
- Opportunities and Diagnostics: In these sections, Google PageSpeed Insights gives you specific suggestions on how to make your site faster, such as compressing images or getting rid of unused code. It even ranks these suggestions by how much they can improve your page speed so that you know what to focus on first.
- Field Data and Lab Data: The tool looks at both Field Data from real users over the past 28 days and Lab Data from a controlled test environment. This lets you get a good sense of how your site performs for real visitors while also seeing how it behaves under ideal conditions. It’s extremely useful to combine this data with additional load testing using a load testing tool like LoadView to get realistic data on how your site performs under a load.
- Passed Audits: This section highlights what your website is already doing well so you can keep up the good work while focusing on areas that need improvement.
- Mobile and Desktop Analysis: Google PageSpeed Insights checks your site’s performance on both mobile and desktop devices, which is super helpful since mobile traffic is growing every day. It helps make sure your site loads quickly, no matter how visitors are accessing it.
- Core Web Vitals Status: In addition to measuring Core Web Vitals individually, the tool lets you know if your site “passes” or “fails” these important user experience tests. It’s an easy way to see if you’re meeting Google’s standards.
- User-Friendly Metrics: Besides traditional load times, PageSpeed Insights looks at other user-focused metrics like Time to Interactive (TTI) which shows how quickly users can start clicking around, and Speed Index which tells you how fast your content shows up.
- Detailed Resource Breakdown: The tool also breaks down your website’s resources (like images, scripts, and stylesheets) to show which ones might be slowing things down. It’s super handy for figuring out where your site might need some cleanup.
- Interactive Data Visualization: With a waterfall chart, Google PageSpeed Insights shows you exactly how different resources load on your page. This visual guide makes it easier to see where any slowdowns might be happening.
These features make Google PageSpeed Insights a great tool for keeping your website running smoothly. It’s all about helping you improve speed, user experience, and even search rankings, giving you everything you need to keep your site fast, reliable, and user-friendly!
How to Use the Google PageSpeed Insights Tool

Using Google PageSpeed Insights is straightforward. Here’s a step-by-step guide:
1. Enter Your Website URL:
- Go to Google PageSpeed Insights.
- In the input field, type or paste the URL of the webpage you want to analyze and click the “Analyze” button.
2. Interpret PageSpeed Performance Scores:
- Once the analysis is complete, you will see a performance score ranging from 0 to 100. A score above 90 is considered good, while anything below 50 needs improvement.
- Score Range 90-100: Your web page is highly optimized and performs exceptionally well.
- Score Range 50-89: Your web page has room for improvement but performs reasonably well.
- Score Range 0-49: Your web page has significant performance issues and needs optimization.
3. Examine the Core Web Vitals:
- PageSpeed Insights will show Core Web Vitals metrics, such as:
- First Contentful Paint (FCP): Measures how quickly users see meaningful content on the screen. Faster FCP improves the UX.
- Largest Contentful Paint (LCP): Measures the time for the largest content element to be fully visible. Optimized LCP ensures fast main content loading.
- Cumulative Layout Shift (CLS): Measures visual stability as the page loads. A low CLS score means fewer unexpected content shifts for a user-friendly experience.
- Time to Interactive (TTI): Measures how long it takes for a page to become interactive. Fast TTI allows users to interact comfortably with the page.
- Total Blocking Time (TBT): Measures the time the main thread is blocked by long tasks, causing interactivity delays. Reducing TBT improves the user experience.
- Speed Index: Represents how quickly page contents are populated. A lower speed index indicates faster loading and a better user experience.
4. Explore the Improved Recommendations:
- Under the “Opportunities” and “Diagnostics” sections, PageSpeed Insights lists suggestions for optimizing your page, such as:
- Optimize Images: Compress images to reduce file size without losing quality.
- Eliminate Render-Blocking Resources: Defer loading of unnecessary scripts and styles.
- Reduce Unused CSS: Clean up your stylesheets to improve rendering performance.
5. Optimize Your Site using PageSpeed Insight Recommendations:
- Prioritize the highest-impact opportunities. For instance, reducing the time for LCP can significantly boost the user experience. Most of these optimizations can be done by adjusting your site’s code, installing performance-boosting plugins, or working with a web developer.
Example: Optimizing a WordPress Blog
Let’s say you run a WordPress blog, and you use Google PageSpeed Insights to test your homepage. The performance score for mobile is 55, and you receive a suggestion to optimize images and eliminate render-blocking resources.
For optimizing images, you can install an image optimization plugin like WP Smush or ShortPixel. These plugins automatically compress images without sacrificing quality, improving load times.
You can eliminate render-blocking resources by installing a plugin like WP Rocket which lets you defer JavaScript and CSS files that aren’t immediately necessary to improve your page’s initial loading time.
After implementing these changes, you can re-test your site using PageSpeed Insights and see an improved score and faster page load time.
Best Practices for Using Google PageSpeed Insights
- Test Regularly: Run PageSpeed Insights tests frequently, especially after making changes to your website.
- Prioritize Mobile: With mobile traffic surpassing desktop in many industries, always focus on improving your mobile score first.
- Optimize Images and Code: Compressed images, minimized JavaScript, and clean CSS go a long way in improving website speed.
- Monitor Core Web Vitals: Google’s search algorithm now factors in Core Web Vitals for ranking, making it crucial to monitor these metrics.
- Prioritize above-the-fold content: Ensure that content above the fold loads quickly to provide a better user experience. Optimize the critical rendering path to deliver essential content first.
- Use Content Delivery Networks (CDNs): Distribute static content across multiple servers using CDNs. This reduces latency by delivering content from servers closest to users.
- Implement AMP (Accelerated Mobile Pages): Consider using AMP, a framework for fast mobile web experiences. It optimizes HTML, CSS, and JavaScript and prioritizes above-the-fold content.
Why You Still Need Load Testing
While Google PageSpeed Insights is an excellent tool for measuring and optimizing website speed, it only gives you a snapshot of your site’s performance under normal conditions. But what happens when your site experiences a spike in traffic? That’s where load testing comes in.
Load testing simulates high traffic to see how your site performs when hundreds or thousands of visitors show up at once. This is especially important during peak times like major sales events or product launches. Without load testing, you might risk slow load times or even crashes during these high-demand moments.
A great tool to use for this is LoadView which is a comprehensive cloud-based load testing platform. After fine-tuning your site with Google PageSpeed Insights, LoadView can help you take it a step further by testing your site’s ability to handle real-world traffic spikes. LoadView simulates user activity from different locations and devices, giving you a true sense of how well your site performs under pressure.
By using both Google PageSpeed Insights for everyday performance optimization and LoadView for heavy traffic scenarios, you’ll ensure that your website not only runs smoothly during regular visits but also stays reliable when it really counts. This combination of tools keeps your site fast, stable, and ready for anything!
Conclusion
Google PageSpeed Insights is a powerful tool for website owners looking to improve their site’s performance and user experience. By analyzing your page’s speed and following the tool’s recommendations, you can significantly enhance your website’s loading times. Remember that PSI is just one part of your performance strategy. Pairing it with regular load testing ensures your site performs optimally under any conditions.
And don’t forget about Dotcom-Monitor, which offers comprehensive monitoring solutions to keep an eye on your site’s uptime, performance, and overall health 24/7/365. By using Google PageSpeed Insights for optimization, LoadView for load testing, and Dotcom-Monitor for continuous monitoring, you’ll have all the bases covered to ensure your website is fast, stable, and always ready to provide a great experience for your visitors.

