Announcing BrowserView Monitoring at Internet World Tradeshow: Dotcom-Monitor Launches Worldwide Speed Performance Website Monitoring Solution
Minneapolis, Minnesota – April. 20, 2012 – Dotcom-Monitor, (www.Dotcom-Monitor.com), today announced the immediate availability of BrowserView Monitoring™ website speed testing solution testing using Chrome, Firefox, and Internet Explorer browsers from worldwide locations.
“The 20th anniversary of Internet World is an ideal launch event for BrowserView Monitoring,” said Vadim Mazo, Chief Technical Officer (CTO). “Obviously, slow web pages frustrate website customers. Having the ability to affordably uncover website issues and make constant improvements is a key goal for website marketing and IT,” noted Mazo, “Consistent delivery of web pages at peak speed is critical to customer satisfaction and repeat visits.”
It can be tried live here https://www.dotcom-monitor.com/WebTools/technical-tools-browser-test.aspx or at booth E2034 at the Internet World Tradeshow.
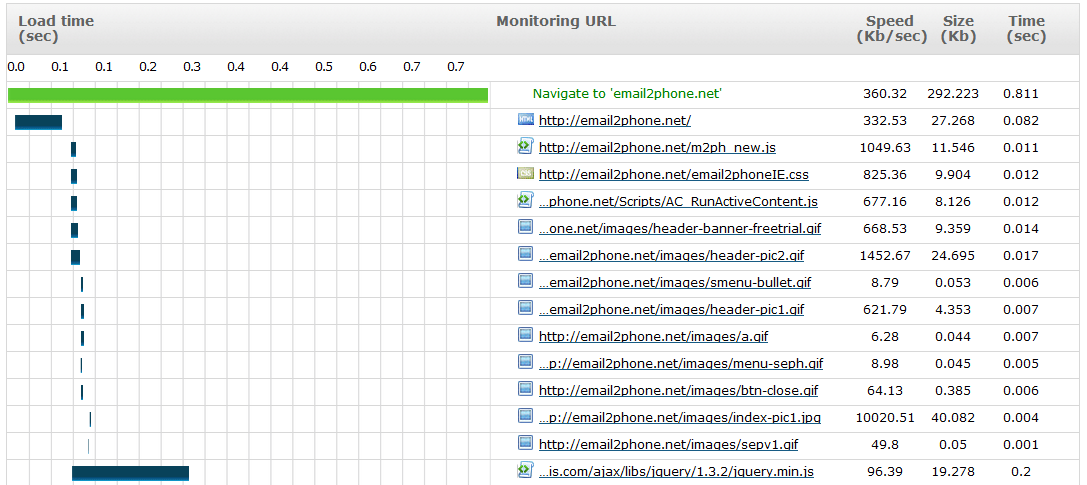
BrowserView Monitoring ensures that website owners have insights on how their web pages perform with the speed and reliability users and customers expect. It can continually monitors web page load times multi real browsers from multiple points around the world and alerts website owners when issues arise. These issues can include problems a browser detects experience when connecting and loading a webpage, such as: 400 errors, 500 errors, third-party hosts problems, Domain Name Server (DNS) issues; slow images, style sheets, JavaScript; social media application (Facebook, Twitter, Google 1+ etc…), Content Delivery Network (CDN) hiccups and more. Website owners can identify trends before they become problems and quickly react when page performance is compromised in order to maintain an optimal user experience.
Easy To Setup & Use
“Dotcom-Monitor web performance monitoring platforms are simple to use and BrowserView Monitoring is no exception,” said Mazo. Once created, users configure alerting preferences and the monitoring locations. It takes less than 5 minutes to create a highly customized monitoring device that will instantly alert website owners and provide detailed diagnostics when performance problems occur.
Web Performance – Instant Alerts & Notifications
Dotcom-Monitor connects to your website from over 20 locations around the globe. The moment an issue occurs BrowserView Monitoring sends alerts via phone, text, e-mail, SMS and more. Alerts are customizable by location, time of day, type of alert and more. Built-in false-positive technology, customizable escalation protocols, and multi-user/group support ensures that everyone who needs to know about a problem is notified at the right time using the right notification method.
Web Page Speed – Detailed Diagnostics & Reports
BrowserView Monitoring connects to a website using a web browser collecting accurate “end user” analytics of page speed and performance. When issues are detected several diagnostic processes are initiated, including a network traceroute, a snapshot of the webpage and the page code source at the time of the error. As a result website marketing and IT personnel can quickly identify whether the root cause is application, server, or network related.
In order to ensure the most accurate and consistent measure of network latency Dotcom-Monitor positions its monitoring locations in high-capacity, secure data centers that connect directly to major Internet backbones (typically T3, or higher lines).
###
For more information, contact Brad Canham at Dotcom-Monitor, 1-888-479-0741 ext.1, or email at sales (at) dotcom-monitor.com. Follow us on Twitter: @Dotcom_Monitor.
Dotcom-Monitor is the #1 choice of IT monitoring experts for worldwide external monitoring to reduce the risk of downtime and performance issues that impact an organization’s online revenues and reputation.
Dotcom-Monitor brings together Monitoring, Reporting, Notification, Escalation and Analysis in the combination best suited to your needs. To learn more about web application, user experience, website monitoring, network monitoring, and server monitoring services, as well as web load stress testing services go to www.Dotcom-Monitor.com


