
Integration Showcase:
Dotcom-Monitor’s LoadView and Dynatrace are performance-engineering platforms by heart. Both have an excellent customer base, are fully Cloud native solutions and root on a long-standing history. This showcase demonstrates how the combination of both tools will close remaining gaps in the performance engineering chain.
My major steps in this showcase were:
Registration
Trial account for Dynatrace SaaS
Trial account for dotcom-monitor LoadView SaaS
Installation
EasyTravel demo application on AWS server
LoadView scripting tool Easystep on AWS server
Configuration
Firewall on AWS server
AWS server security policy
Dynatrace request attribute
Setup Load Test
Recorded EasyTravel testing script
Setup load test scenario and execute the test
Result Analysis
Review LoadView end-to-end response times
Deep dive analysis of correlated results in Dynatrace
LoadView is a SaaS based load testing platform fully equipped with protocol, headless or full browser based user simulation techniques. It provides testing support for more than 40 devices such as IE, Chrome, Firefox and top mobile devices such as IPhone, Samsung, Nokia, Blackberry and many more.
Dynatrace is a SaaS based monitoring solution and supports a broad range of technologies. Its powerful OneAgent injects all services automatically, captures the service flow and all interactions from the end user, network, and middleware through backend tiers and provides insights to actual bottlenecks.
The picture below highlights the main integration steps between both solutions.
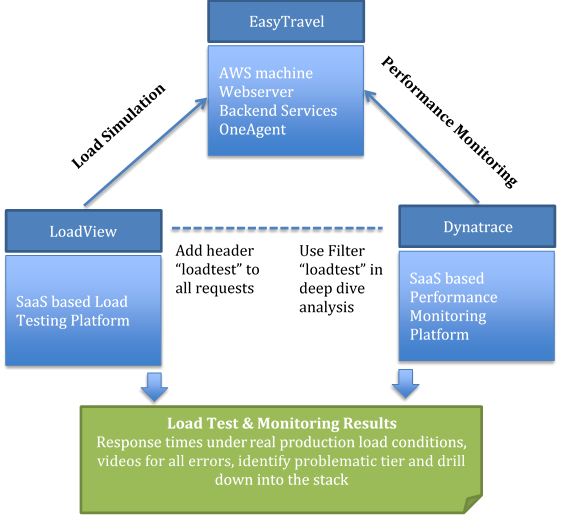
Software used in the showcase:
Dynatrace SaaS – Monitoring Platform from Dynatrace
Dynatrace OneAgent – Monitoring Agent from Dynatrace
EasyTravel – Demo application from Dynatrace
LoadView – Load Testing Platform from dotcom monitor
EveryStep – Scripting tool from dotcom monitor
Setup Demo App EasyTravel on AWS Box
Installed EasyTravel on AWS box
Easytravel setup
Start Easytravel demo app
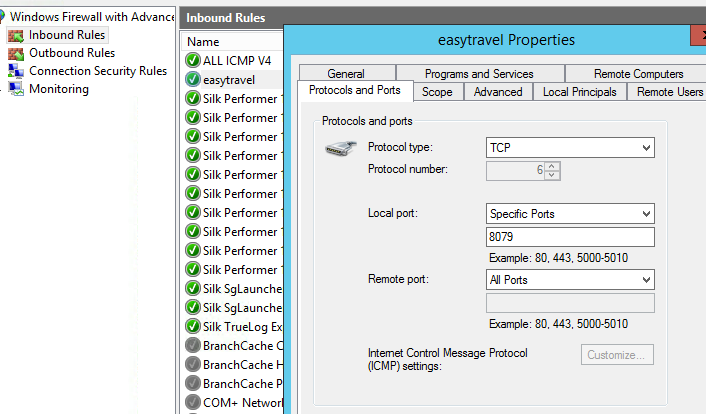
Add inbound and outbound windows firewall rule on test server for port 8079
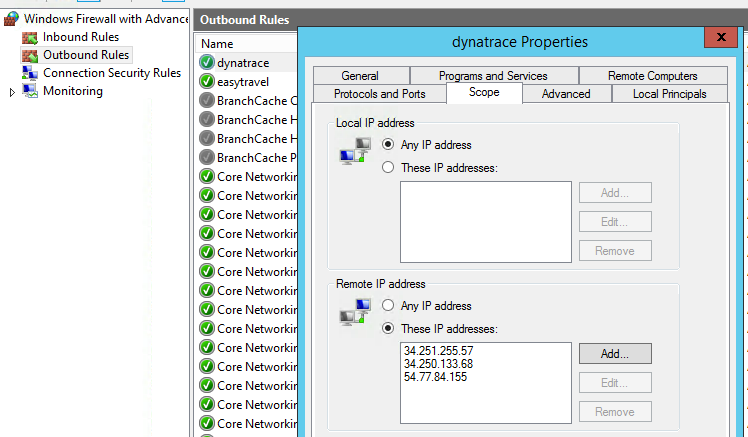
Add outbound rule for the IPs below on AWS box to allow communication with Dynatrace SaaS backend
34.251.255.57
34.250.133.68
54.77.84.155
Link to my Easytravel demo application hosted on AWS server:
Connect demo application hosted on AWS to Dynatrace
Used this documentation for the setup:
Create key based access for amazon account
User: dynatrace
AKID: …
Secret access key: …
Custom Policy: watch
Connect amazon account to Dynatrace
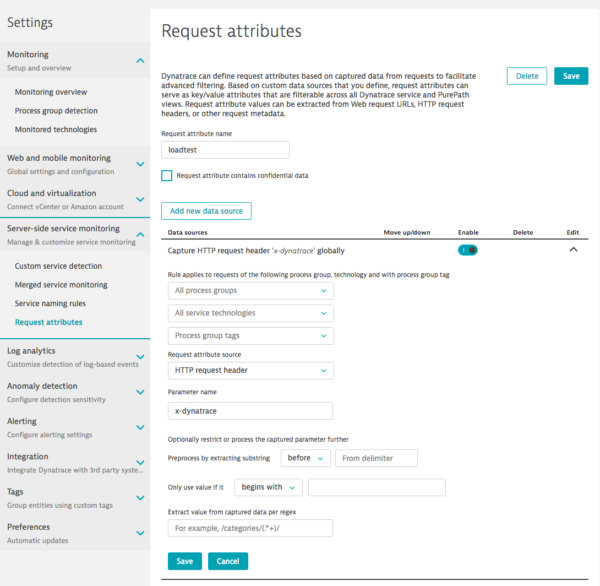
Dynatrace Configuration
Setup the loadtest request attribute name
Go to Settings / Server-side service monitoring
Create a new request attribute called loadtest
Click on Add new datasource
Set the Parameter name to x-dynatrace
Click on Save
Attention: use lower case characters in both the attribute and parameter name
Detailed documentation:
https://www.dynatrace.com/blog/request-attributes-simplify-request-searches-filtering/
LoadView – Create Load Testing Script
- Record a Browser based script, which clicks through the demo application EasyTravel
- Replay the Browser based script
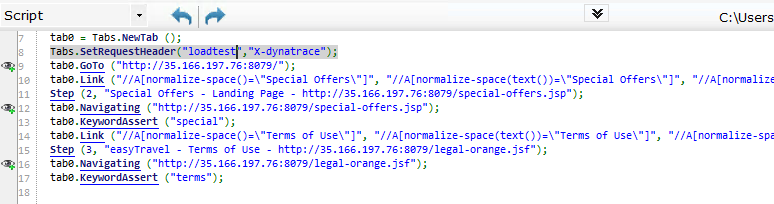
- Edit the load testing script and add the following code section after tab0 variable initialized: Tab.SetRequestHeader(“loadtest”,”x-dynatrace”);
Execute the EveryStep Script load test script several times (single user)
Upload the load test script to LoadView Platform
LoadView – Execute Load Test
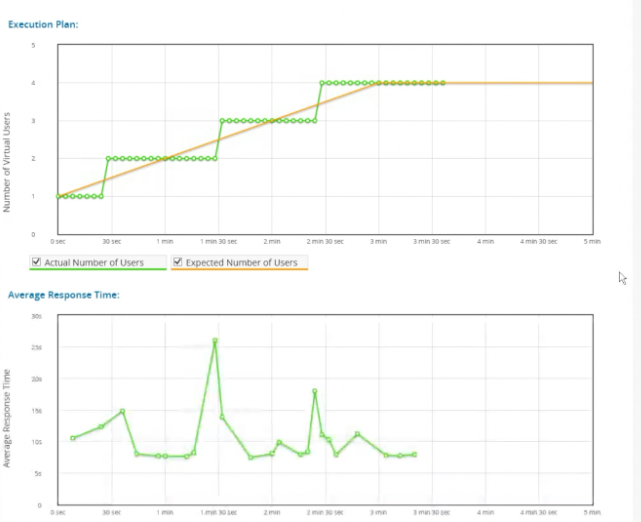
Start the load test of EasyTravel

Watch how user ramp up and E-2-E response times behaves during the run
Dynatrace – Deep dive analysis
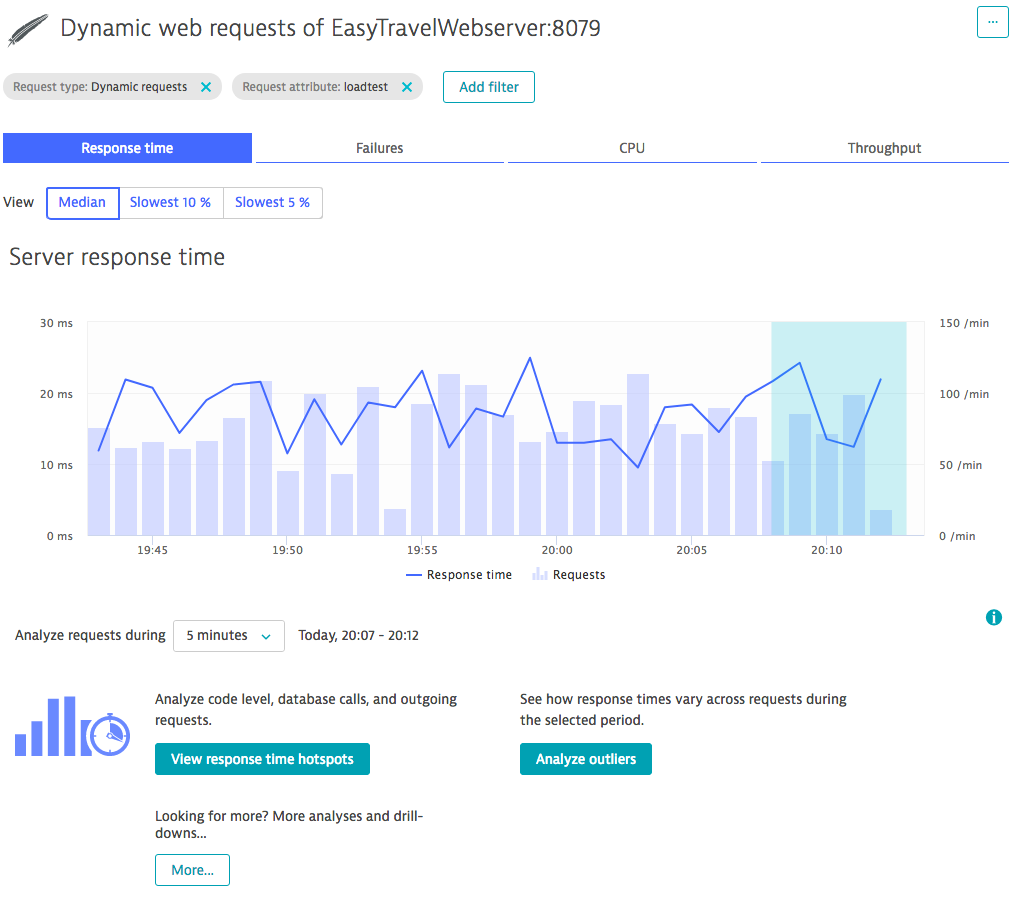
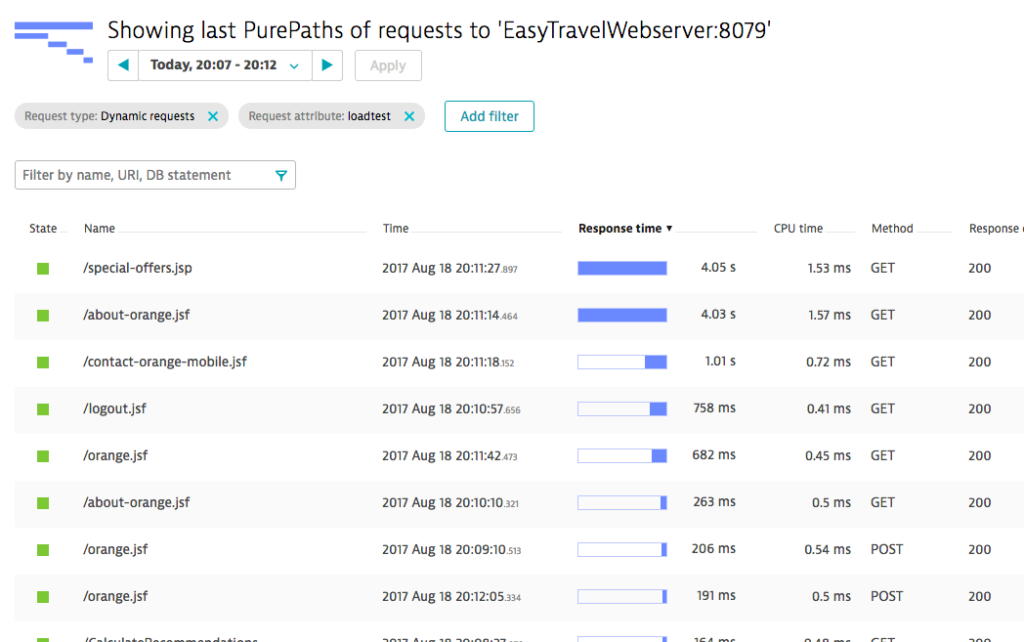
Get a list of long running requests
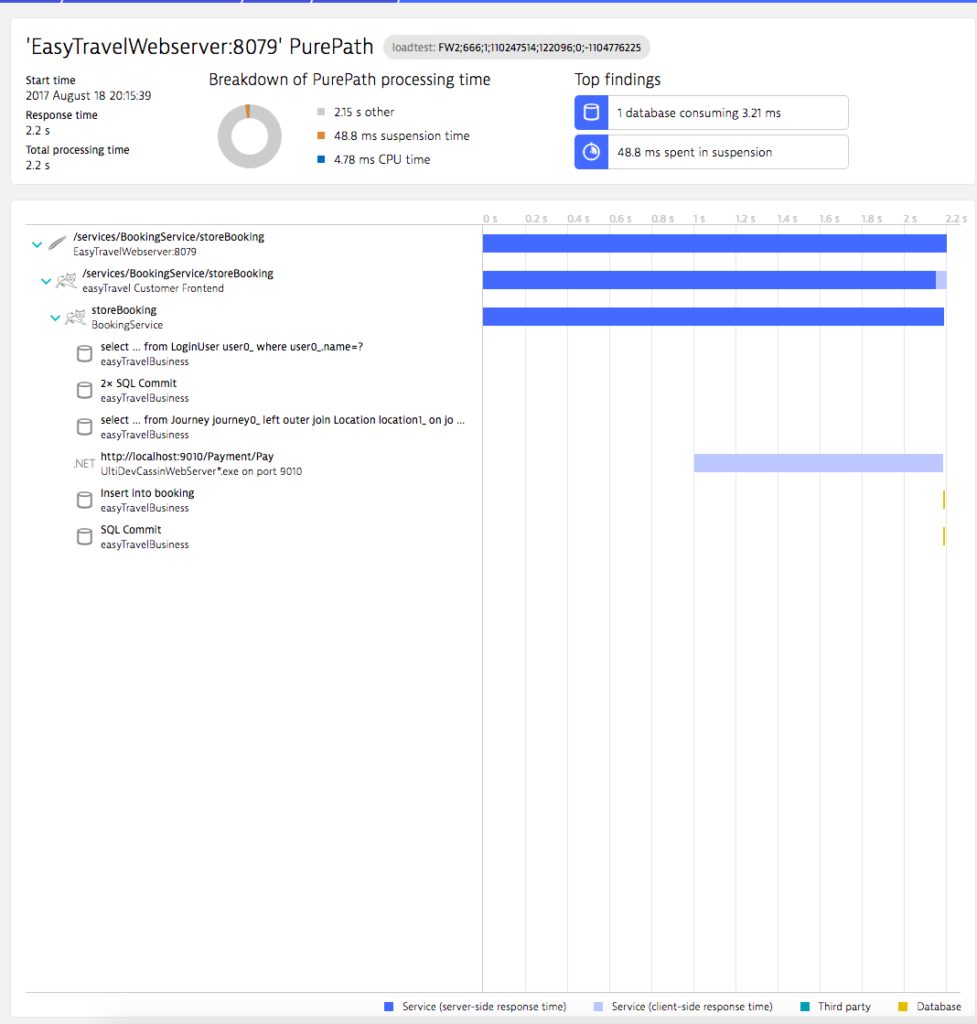
Details for a long running request, find problem spot
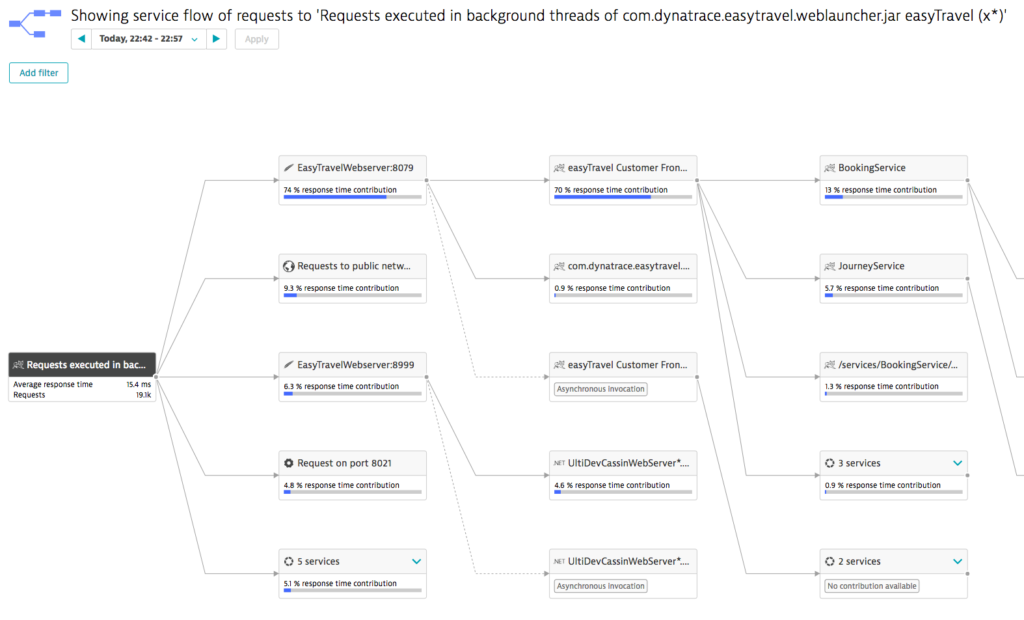
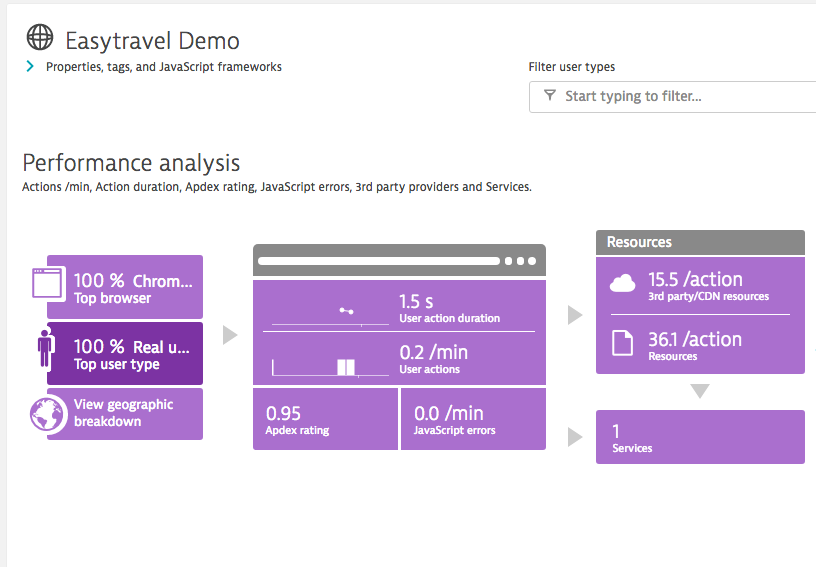
Big picture, start the performance analysis from there
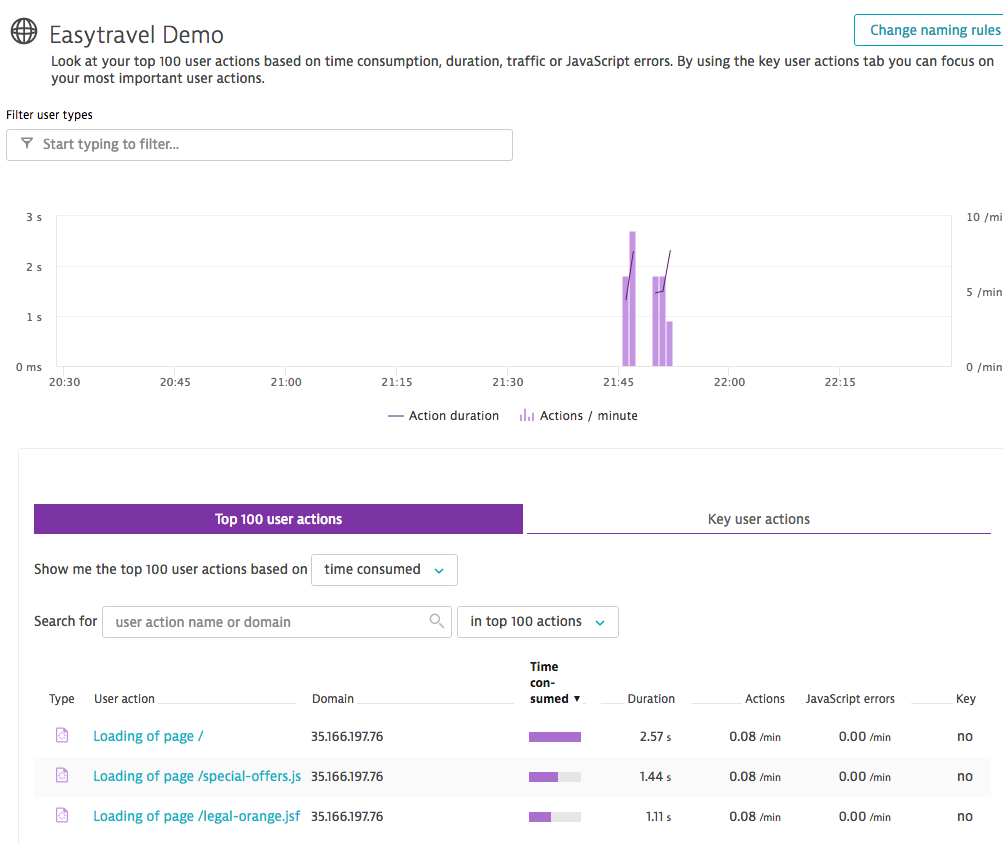
User Actions
Benefits:
Load Testing and Performance Monitoring are two rising stars. Organizations can no longer ignore not reliable applications because customers are on the driver seat and often quickly spend their money on other, more reliable sites. Due to this negative financial impact of increasing abandon rates and growing need for fast deployment cycles companies are seeking for a way out of this performance dilemma.
Load generation on early development stages gives confidence how the end-to-end response times develop under multi-user conditions. Testers often use load injection to verify non-functional requirements on pre-production stages.
Performance Monitoring provides insights how the application tiers deal with their service requests. Developer and operational staff often use it to find problem hotspots in their applications.
There are significant benefits if you combine LoadView & Dynatrace:
- Find performance issues early in the life cycle
- Find root-cause of performance issues
- Reduce re-run effort
- Check how services behaves under real production load conditions
- Understand communication pattern
- Verify hardware sizing
- Make application tuning much easier
- Cut costs and pay only the used services
- No internal infrastructure for performance engineering activities required
Successful companies integrated performance engineering in their development lifecycle. They simulate actual and future growth pattern on pre-production stages, identify and fix hotspots and deploy those tuned application into production. Even at production there is guesswork banned out. They permanently monitor user experience, capture all transaction and detect problems automatically based on actual and historic figures. LoadView & Dynatrace are great steps towards lean and reliable IT services.
Ideas How to Improve This Integration