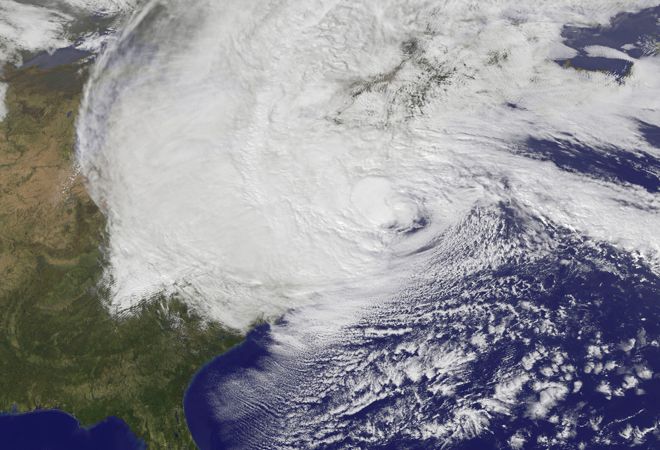
Oct. 29, 2012, 2:15 PM CST – Tracking Hurricane Sandy Impact on Service Providers, Data Centers, and Servers. Dotcom-Monitor is tracking the potential impact of Hurricane Sandy on networks. Those interested in tracking network latency in the Northeast can see it live here. Pay close attention to VA, USA; NY, USA; and Amazon-East-USA monitoring locations.
Check for Hurricane Sandy impact on data centers and servers
Hurricane Sandy impact on data centers could be significant. Amazon, Google and Apple all have enormous East Coast data centers. The Amazon East Coast data center itself is estimated to carry 1% of all Internet traffic worldwide. It was widely reported that Amazon experienced a weather-related outage in June of 2012 impacting such companies as Netflix and Instagram, as well as Amazon itself. With that in mind, even Amazon Sandy stock analysts noted they will be keeping a close eye on Amazon’s East Coast data center performance during Hurricane Sandy. Conduct free instant tests on servers, including: HTTP/S, FTP, Ping/ICMP, POP3/SMTP, media streaming – located here.

Many major Northeast data centers are reported to be testing and fueling on-site emergency back-up generators, as well as West Coast back-ups systems in anticipation of Hurricane Sandy. There is concern that smaller data centers in low lying affected areas may not have as robust back-up measures in place.
Check for Hurricane Sandy impact on your web server, or website
Websites owners concerned about uptime and performance impacts due to Hurricane Sandy can freely test the status of their websites here. To test websites and servers from the Northeast to your web server select NY, USA; VA, USA; and Amazon-US-East monitoring locations and click Run Test. To test your website or servers located in the Northeast select a few, or all monitoring locations and click Run Test. In both cases, you’ll see an average response time from each location and by clicking on “Detailed Report” you can determine if the entire website has slowed, or if specific web page elements (perhaps served out of the Northeast) are being impacted by Hurricane Sandy. These detailed reports are available for emailing to yourself for deeper analysis of website performance.

